
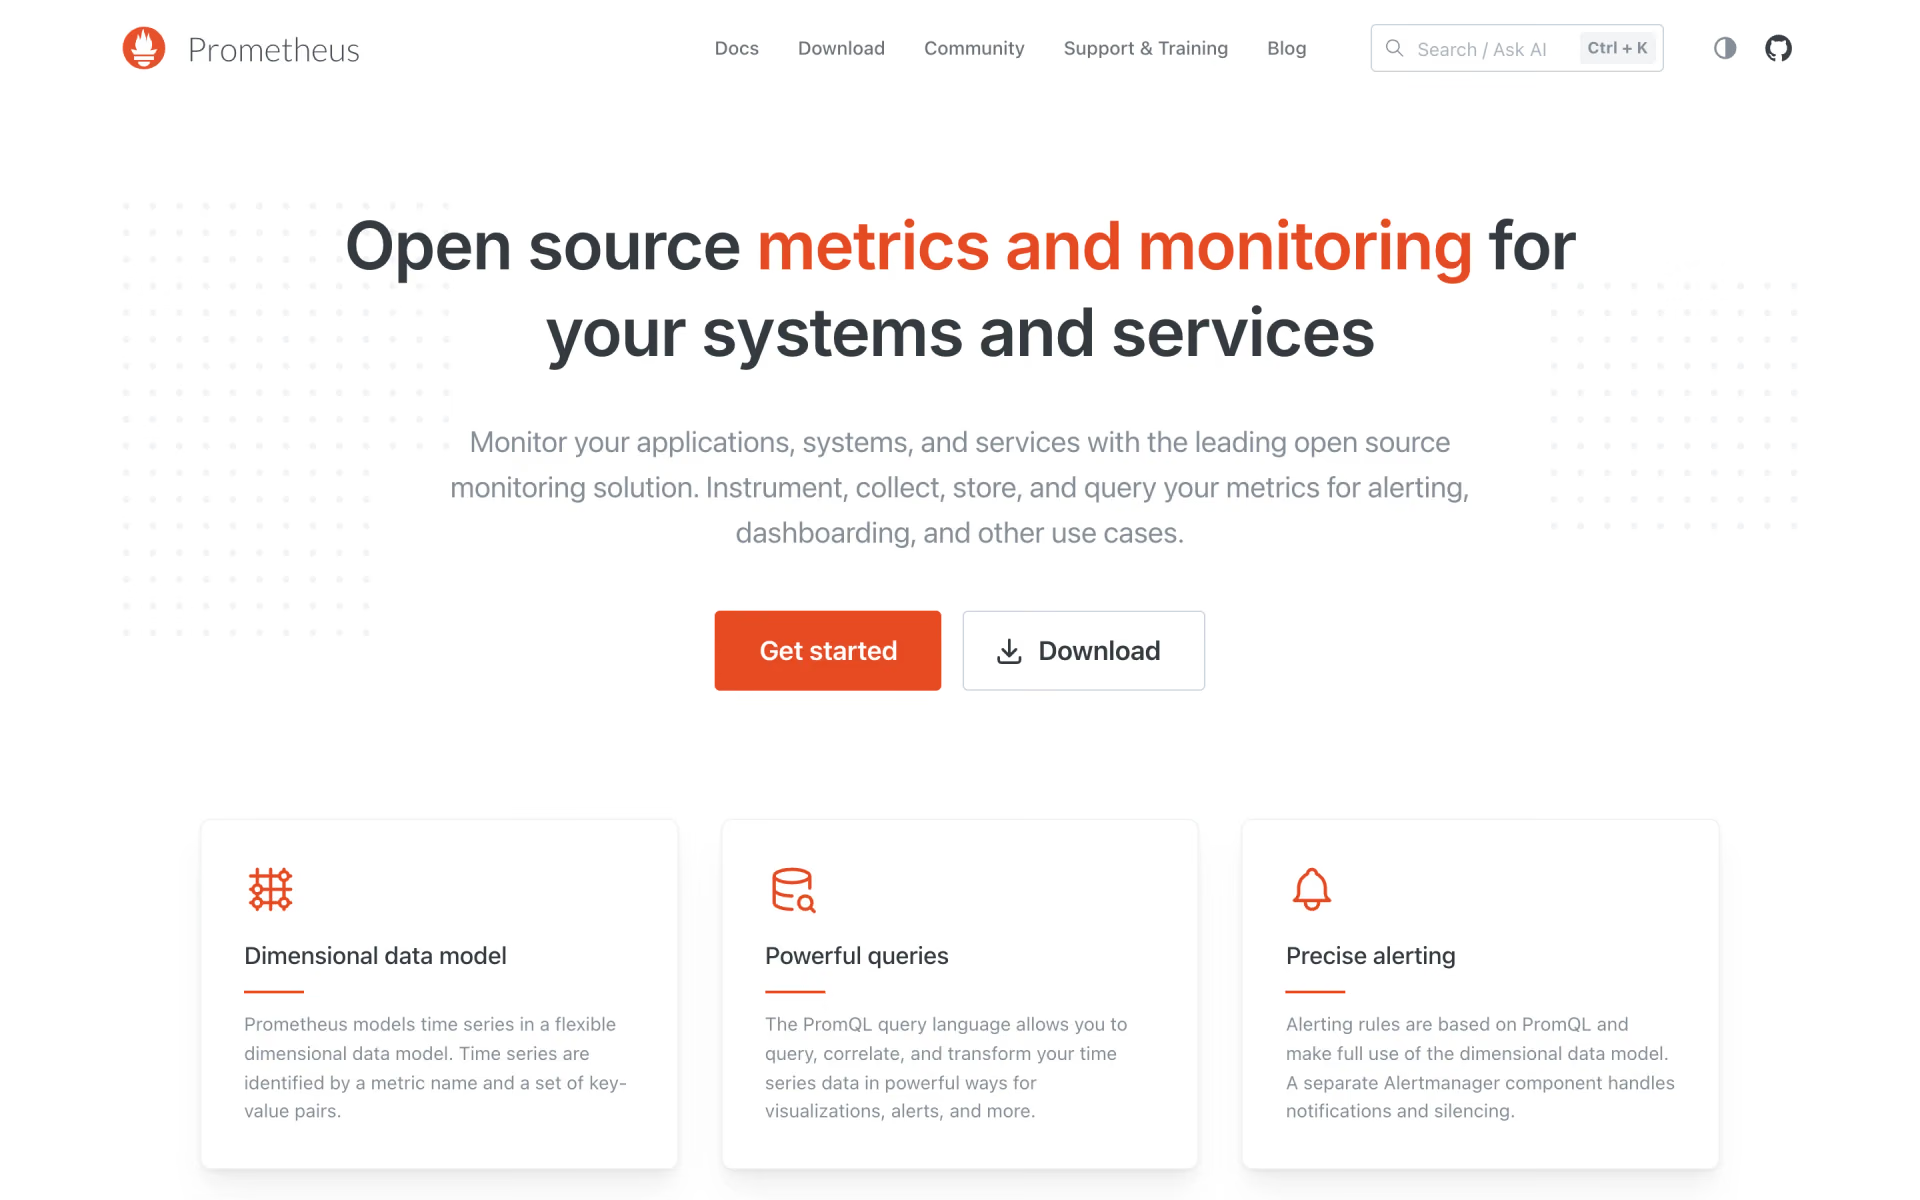
What is Prometheus?
Collects time series metrics from servers and apps, with the PromQL query language and alert rules.
Who is Prometheus best for?
Prometheus is best for SRE and platform teams that need metrics and alerts for services on Kubernetes or plain servers.
Kubernetes clusters
Prometheus discovers services in Kubernetes and other container managers and keeps scraping them as they change.
Alerting on service health
Alert rules are written in PromQL, and the separate Alertmanager handles notifications and silencing.
Instrumenting your own code
Client libraries cover most major languages, and hundreds of integrations pull metrics from existing systems.
Monitoring that survives outages
Each server stands alone on local storage, so it keeps working when other parts of your stack fail.
How much does Prometheus cost?
Prometheus is free and open source under Apache 2.0, with no paid edition or hosted plan from the project itself.
- Apache 2.0 for every component
- Precompiled binaries or Docker images
- No paid edition from the project
Prometheus is a Cloud Native Computing Foundation project and sells nothing; your costs are the servers and disks it runs on. Full pricing on github.com. We checked these prices on .
How do readers rate Prometheus?
No one has rated Prometheus yet. Be the first.
Sign in to rate. One rating per account.
Is Prometheus open source?
Yes. Prometheus's code is public under the Apache 2.0 licence, so you can run it on your own server.
On GitHub
67,596stars
+1,086 (+1.6%) in the last 30 days
- Last commit
- 12 Nov
- Repository age
- 13 years
- Latest release
- 5 Nov
- Licence
- Apache 2.0
- Self-hosted
- Yes
- Repository
- prometheus/prometheus






What are the best Prometheus alternatives?
Prometheus is an open source alternative to Middleware and Dash0. Grafana Loki, Grafana, Netdata and SigNoz do the same job and are open source too.
 MiddlewareFree
Full-stack observability with an AI SRE agent.
 Dash0Freemium
Logs, metrics and traces unified, OpenTelemetry-native.
 Grafana LokiOpen Source
Log aggregation system that indexes labels rather than full text, so large log volumes stay cheap.
 GrafanaOpen Source
Charts metrics, logs and traces from Prometheus, SQL databases and 150+ other data sources.
 NetdataOpen Source
Per-second monitoring agent for servers, containers and apps, with dashboards and alerts.
 SigNozOpen Source
Observability platform with logs, metrics, traces and alerts in one place, built on OpenTelemetry.
Questions about Prometheus
What is Prometheus?
Collects time series metrics from servers and apps, with the PromQL query language and alert rules.
Can Prometheus be used for billing data?
No. The Prometheus docs say it is not a good fit when you need 100% accurate data, such as per-request billing, because collected data may not be complete enough. They suggest another system for billing and Prometheus for the rest of your monitoring.
Is Prometheus free?
Yes. Prometheus has a free Self-hosted plan: apache 2.0 for every component.
Is Prometheus open source?
Yes. Prometheus's code is public under the Apache 2.0 licence, so you can run it on your own server.
What are the best Prometheus alternatives?
The closest alternatives on Recaply are Middleware, Dash0, Grafana Loki, Grafana, Netdata and SigNoz.
Where can I try Prometheus?
On its official website, prometheus.io.

 VictoriaMetrics
 GreptimeDB

 Zabbix

 devpush

 BrainHost
 ClickStack