
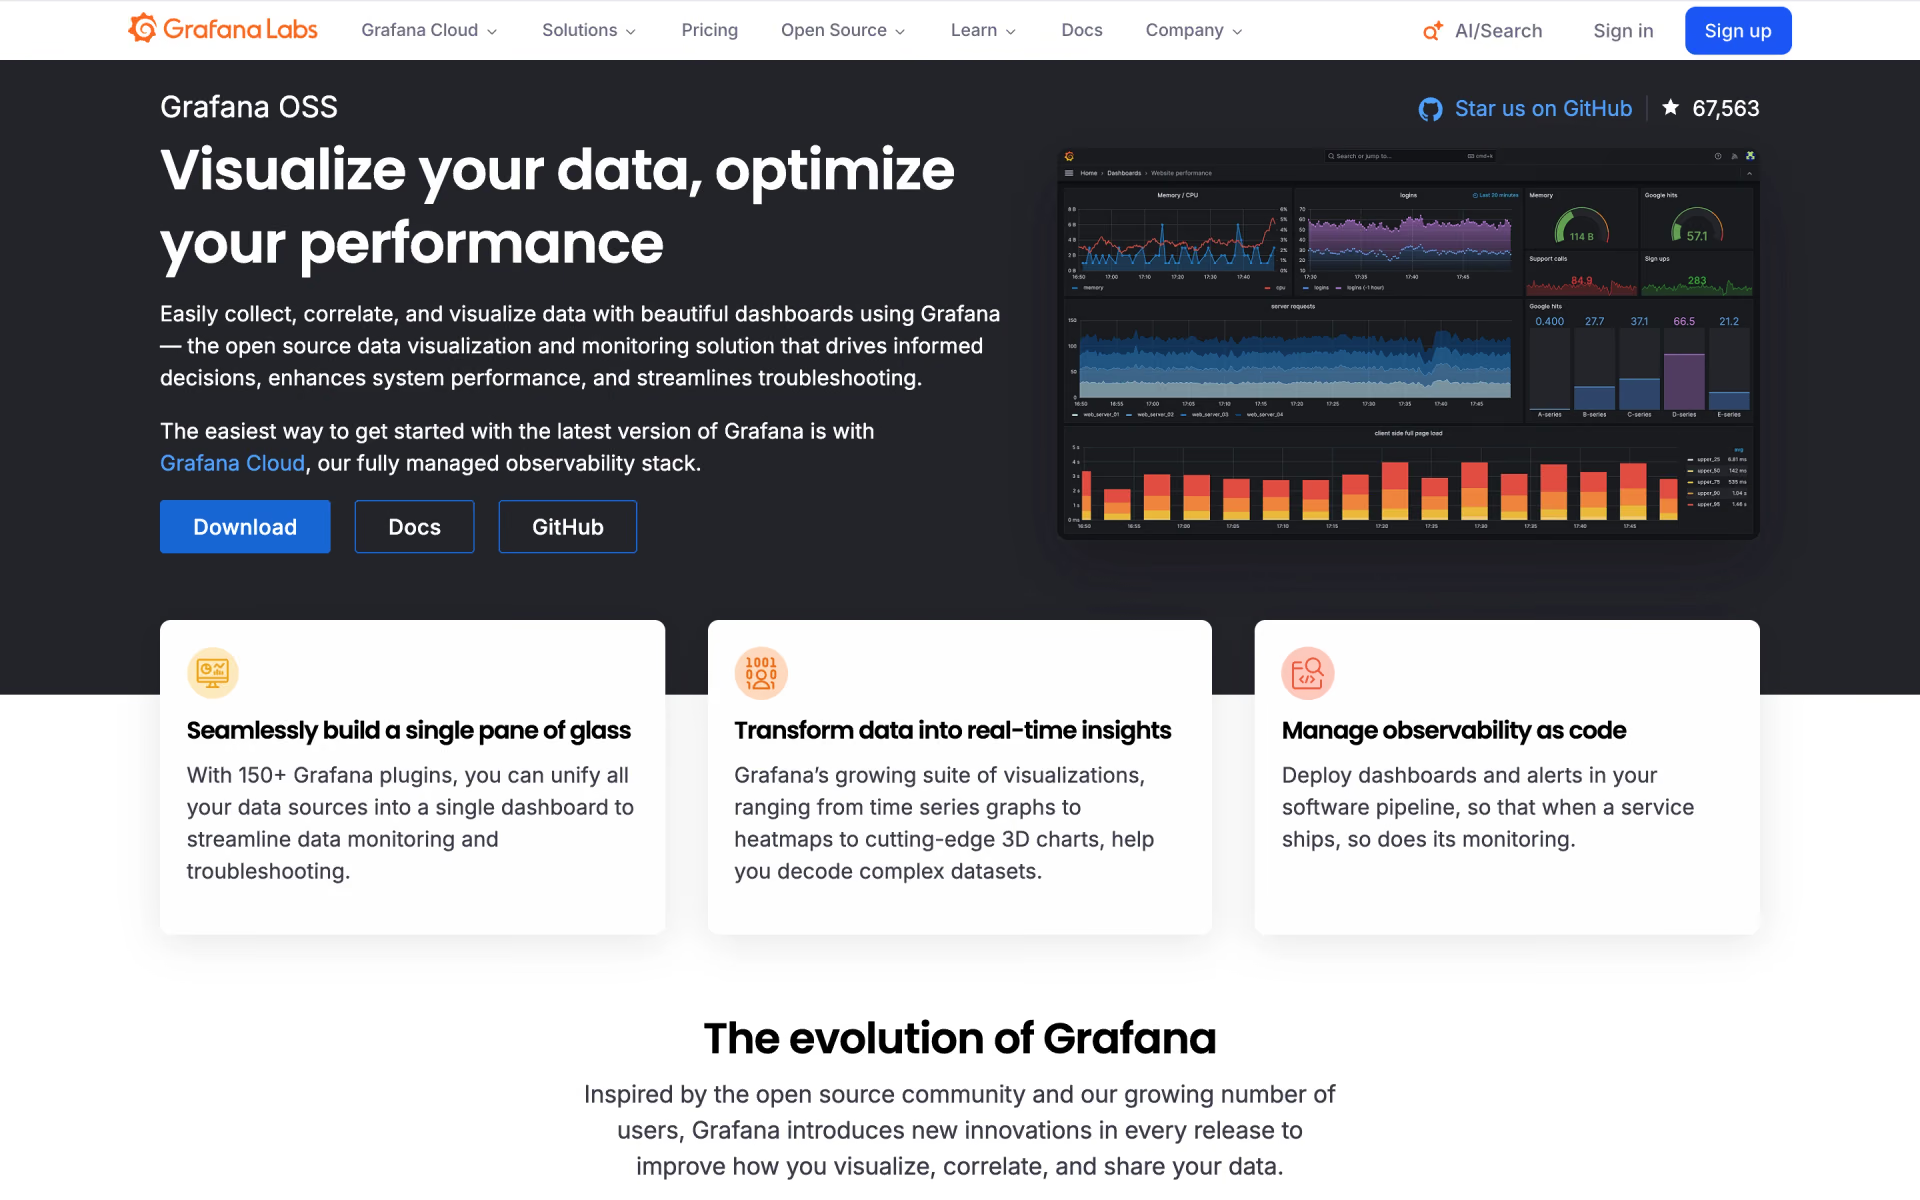
What is Grafana?
Charts metrics, logs and traces from Prometheus, SQL databases and 150+ other data sources.
Who is Grafana best for?
Grafana is best for engineering and ops teams that chart and alert on metrics, logs and traces from many sources.
Teams running Prometheus
Grafana queries Prometheus with PromQL and turns the results into dashboards and alert rules.
One view over many sources
More than 150 plugins let one dashboard combine metrics, logs, SQL tables and cloud services.
Monitoring kept as code
Dashboards and alerts can be deployed from your pipeline, so a new service ships with its monitoring.
Data that stays in-house
The open source build runs on your own servers, so telemetry never has to leave your network.
How much does Grafana cost?
Grafana is free to self-host under the AGPL-3.0 licence, and Grafana Cloud has a free tier, then a Pro plan from $19 a month plus usage.
- Grafana OSS under AGPL-3.0
- Runs on Linux, macOS, Windows or Docker
- You run upgrades, backups and its database
- 10,000 metric series and 50 GB of logs a month
- 3 active Grafana users
- 14 days of retention
- Pay as you go above the free tier
- $8 per active user above 3
- 13 months of metrics retention, 8x5 email support
Pro usage is billed per unit: metrics from $6.50 per 1,000 active series and logs at $0.40 per GB written plus processing and retention, with lower rates at higher volumes. Enterprise starts at a $25,000 yearly spend commit with custom retention and premium support. Full pricing on grafana.com. We checked these prices on .
How do readers rate Grafana?
No one has rated Grafana yet. Be the first.
Sign in to rate. One rating per account.
Is Grafana open source?
Yes. Grafana's code is public under the AGPL 3.0 licence, so you can run it on your own server.
On GitHub
77,874stars
+633 (+0.8%) in the last 30 days
- Last commit
- 13 Nov
- Repository age
- 12 years
- Latest release
- 10 Nov
- Licence
- AGPL 3.0
- Self-hosted
- Yes
- Repository
- grafana/grafana






What are the best Grafana alternatives?
Grafana is an open source alternative to Dash0 and Middleware. Grafana Loki, Netdata, Prometheus and SigNoz do the same job and are open source too.
 Dash0Freemium
Logs, metrics and traces unified, OpenTelemetry-native.
 MiddlewareFree
Full-stack observability with an AI SRE agent.
 Grafana LokiOpen Source
Log aggregation system that indexes labels rather than full text, so large log volumes stay cheap.
 NetdataOpen Source
Per-second monitoring agent for servers, containers and apps, with dashboards and alerts.
 PrometheusOpen Source
Collects time series metrics from servers and apps, with the PromQL query language and alert rules.
 SigNozOpen Source
Observability platform with logs, metrics, traces and alerts in one place, built on OpenTelemetry.
Questions about Grafana
What is Grafana?
Charts metrics, logs and traces from Prometheus, SQL databases and 150+ other data sources.
Who is Grafana for?
Grafana is best for engineering and ops teams that chart and alert on metrics, logs and traces from many sources.
Is Grafana free?
Yes. Grafana OSS is free to download and self-host under the AGPL-3.0 licence. Grafana Cloud also has a free tier with 10,000 metric series, 50 GB of logs and 3 active users a month, kept for 14 days.
How much does Grafana cost?
Grafana's paid plans are Pro at From $19 per month plus usage.
Is Grafana open source?
Yes. Grafana's code is public under the AGPL 3.0 licence, so you can run it on your own server.
What are the best Grafana alternatives?
The closest alternatives on Recaply are Dash0, Middleware, Grafana Loki, Netdata, Prometheus and SigNoz.
Where can I try Grafana?
On its official website, grafana.com.
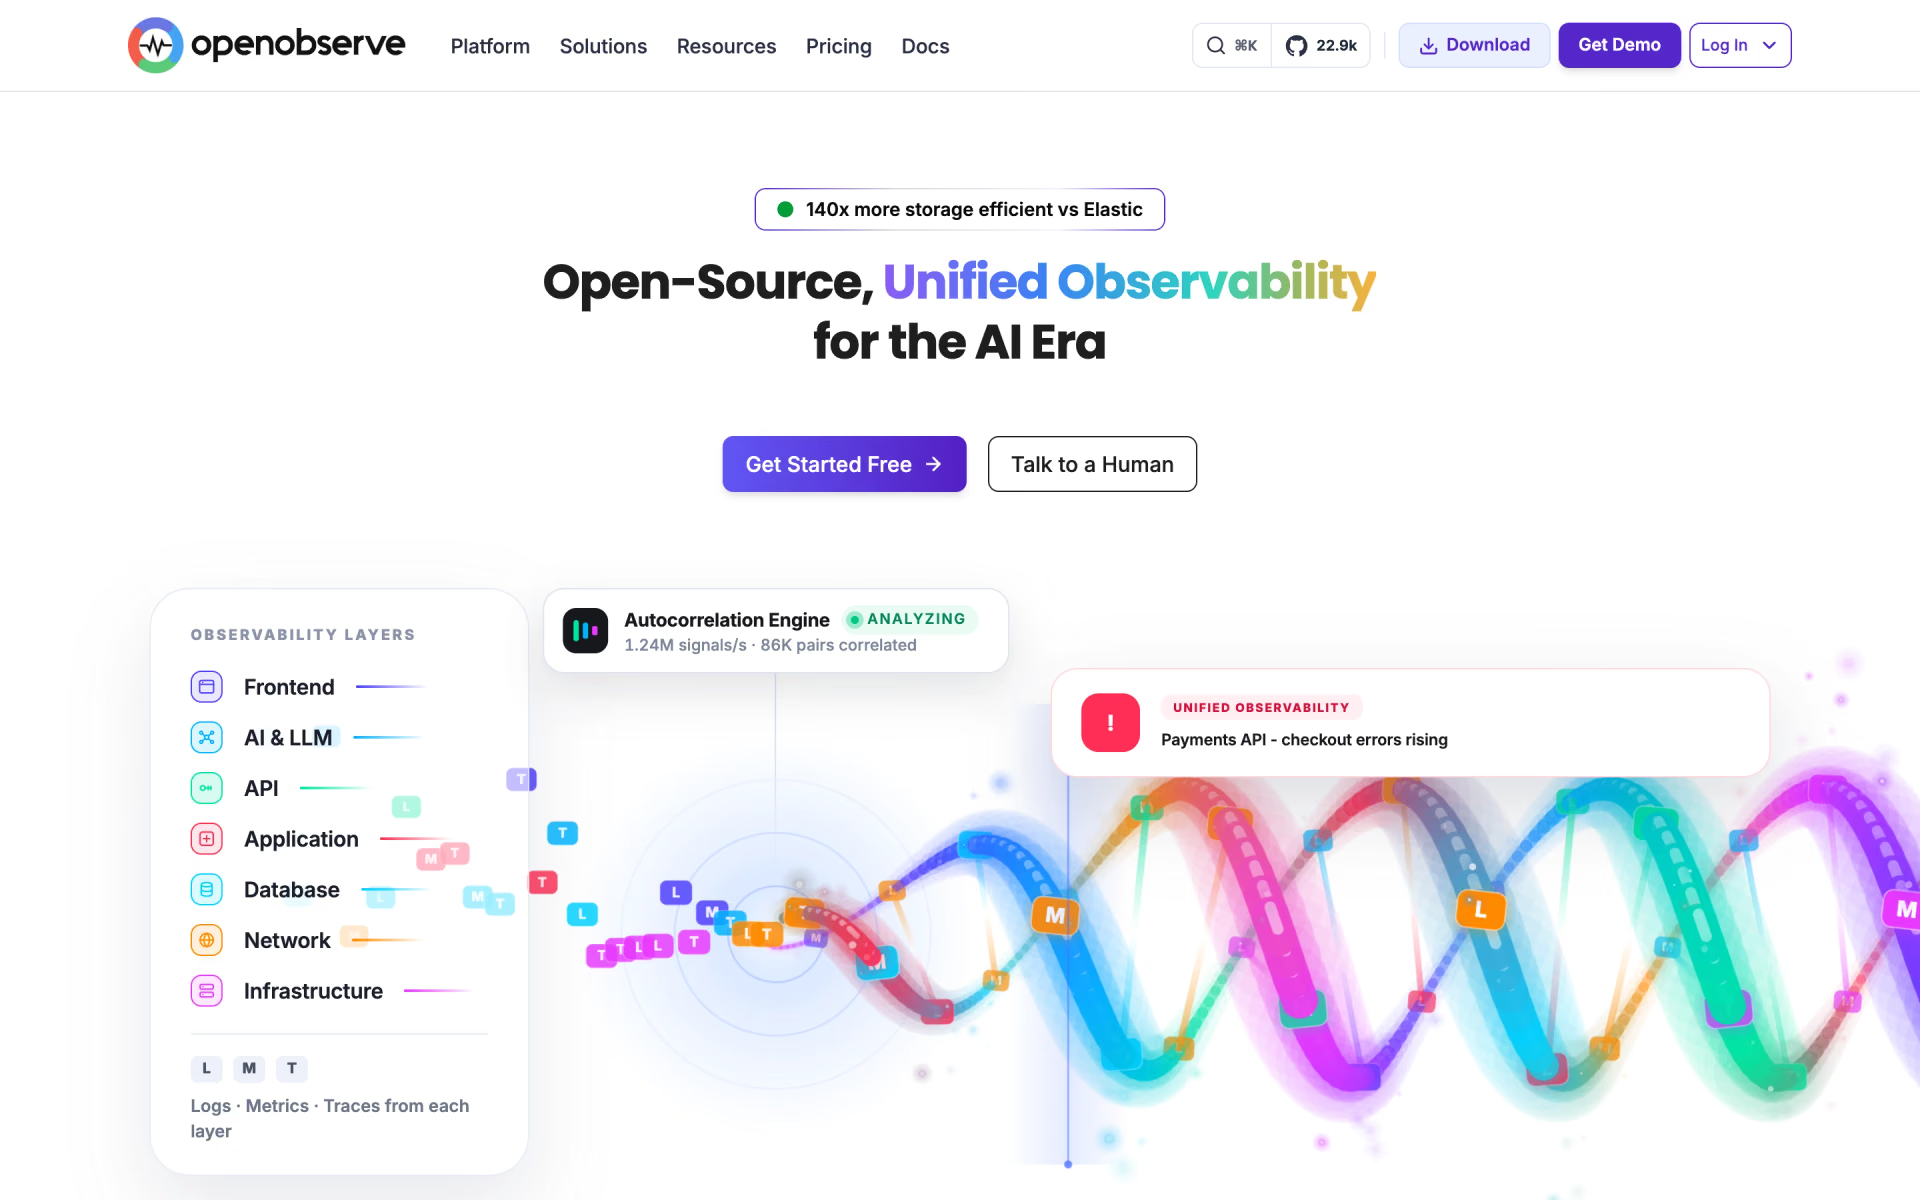
 OpenObserve
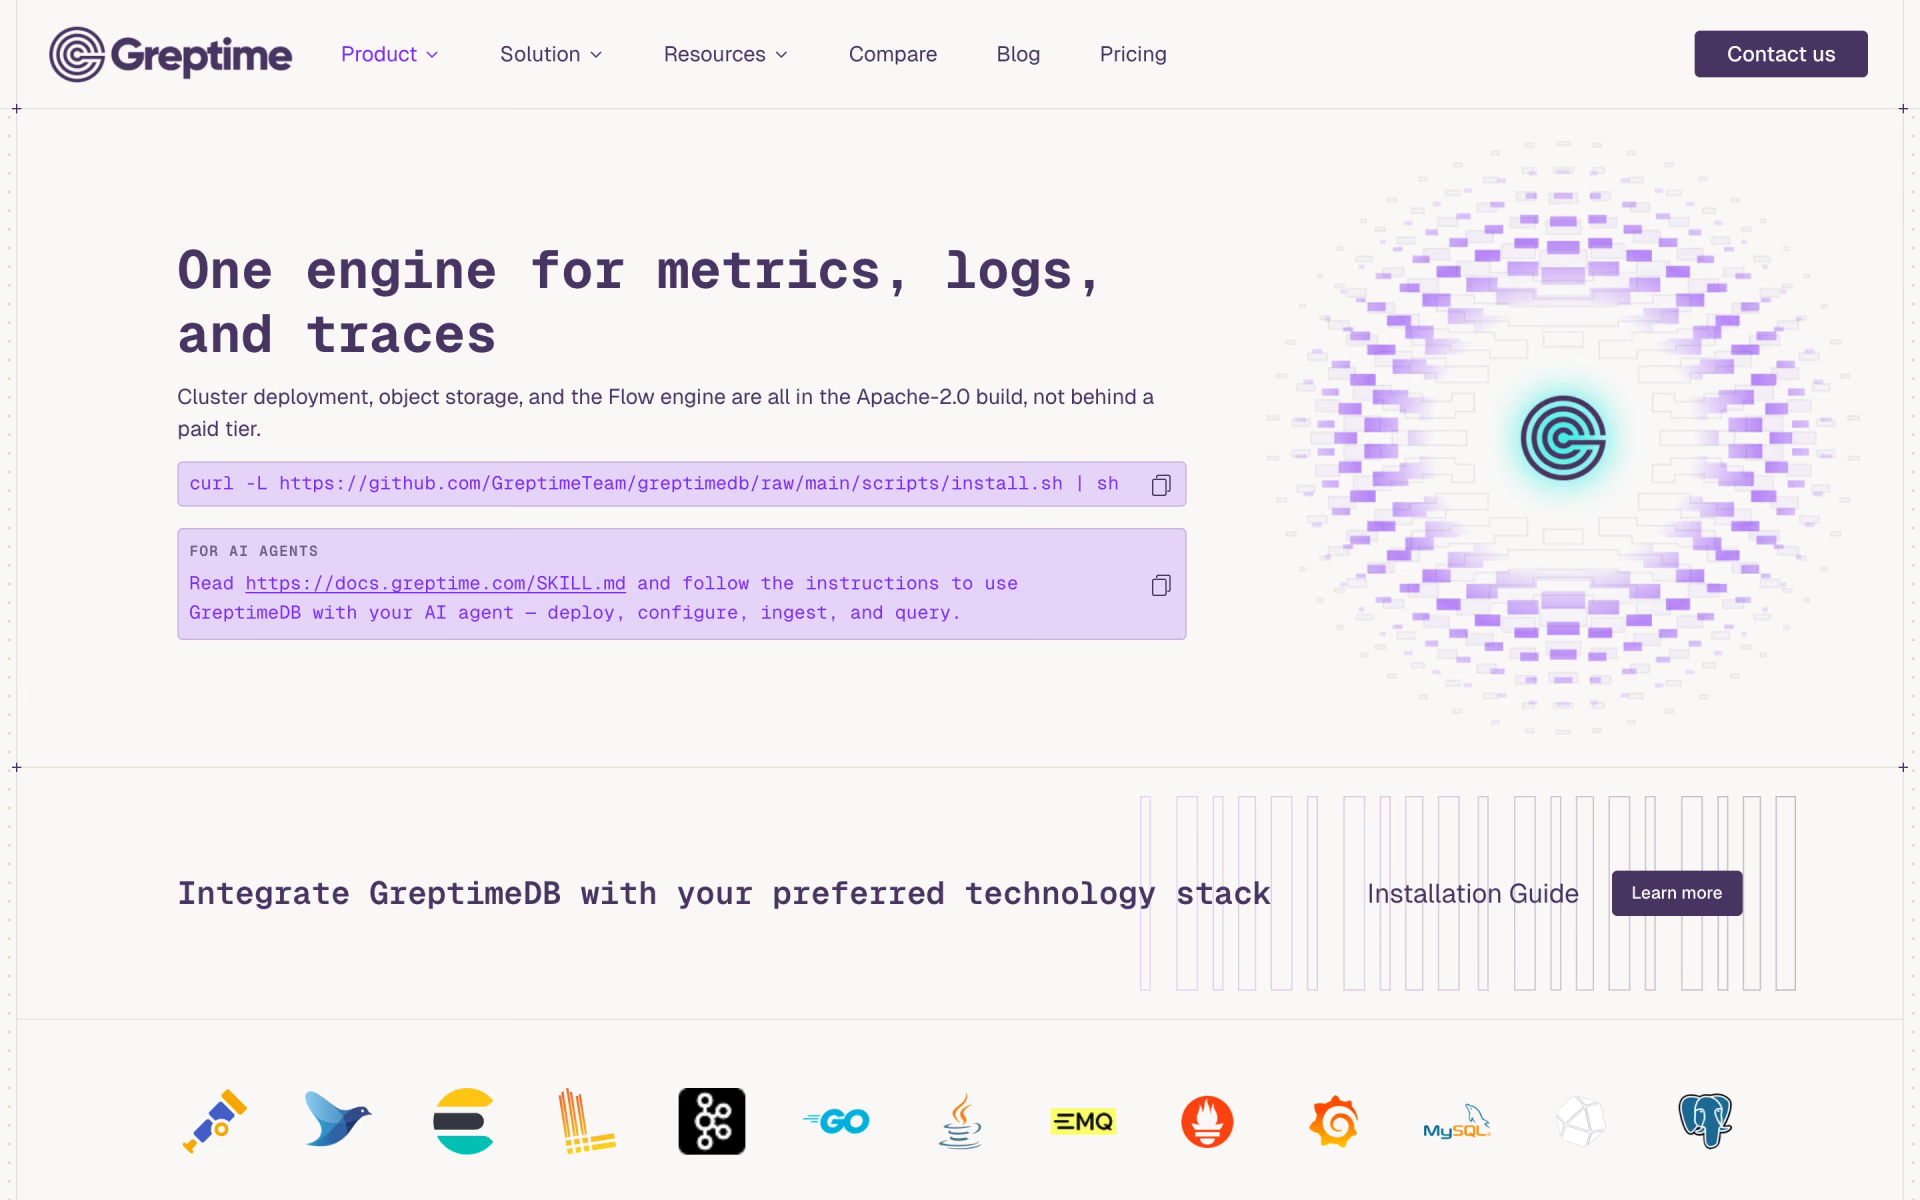
 GreptimeDB

 VictoriaMetrics
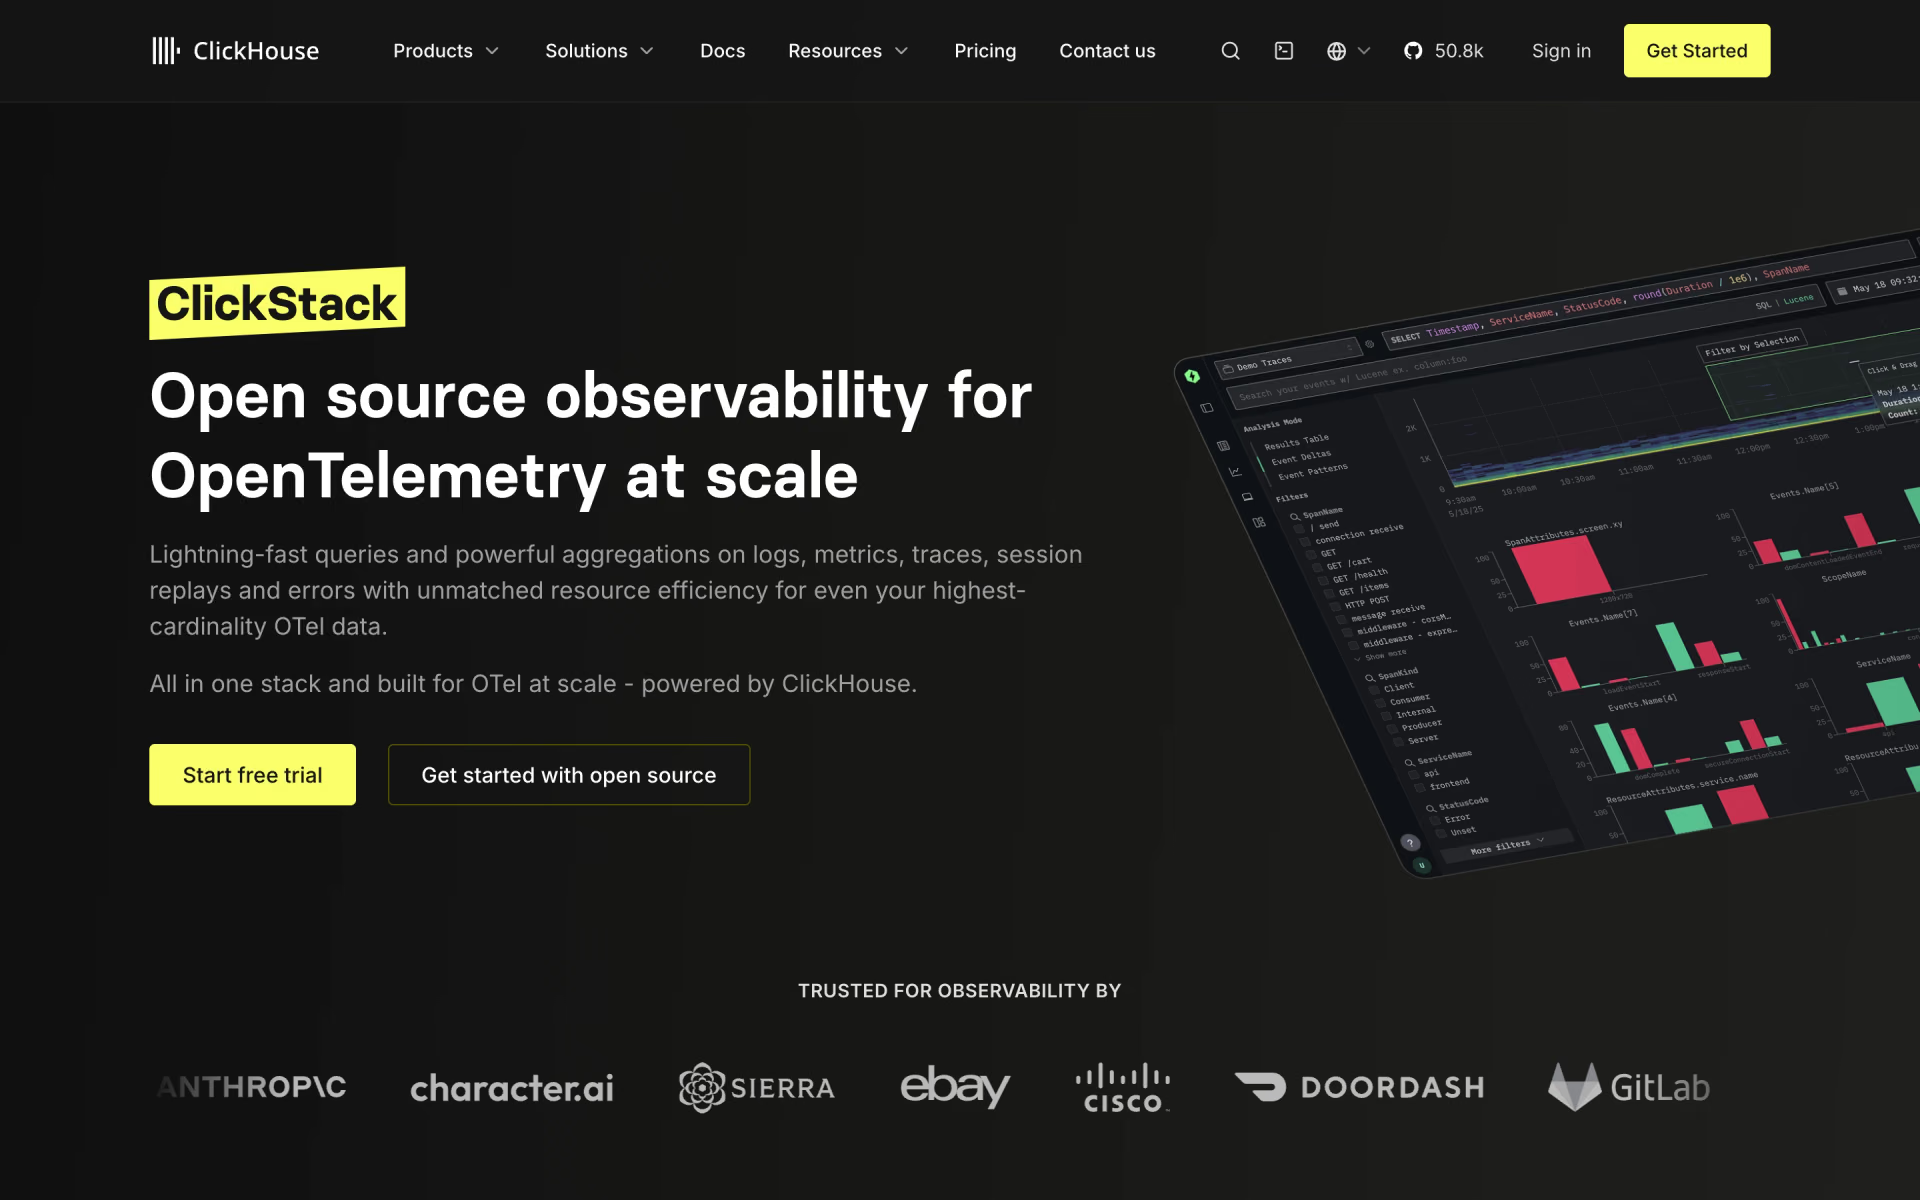
 ClickStack
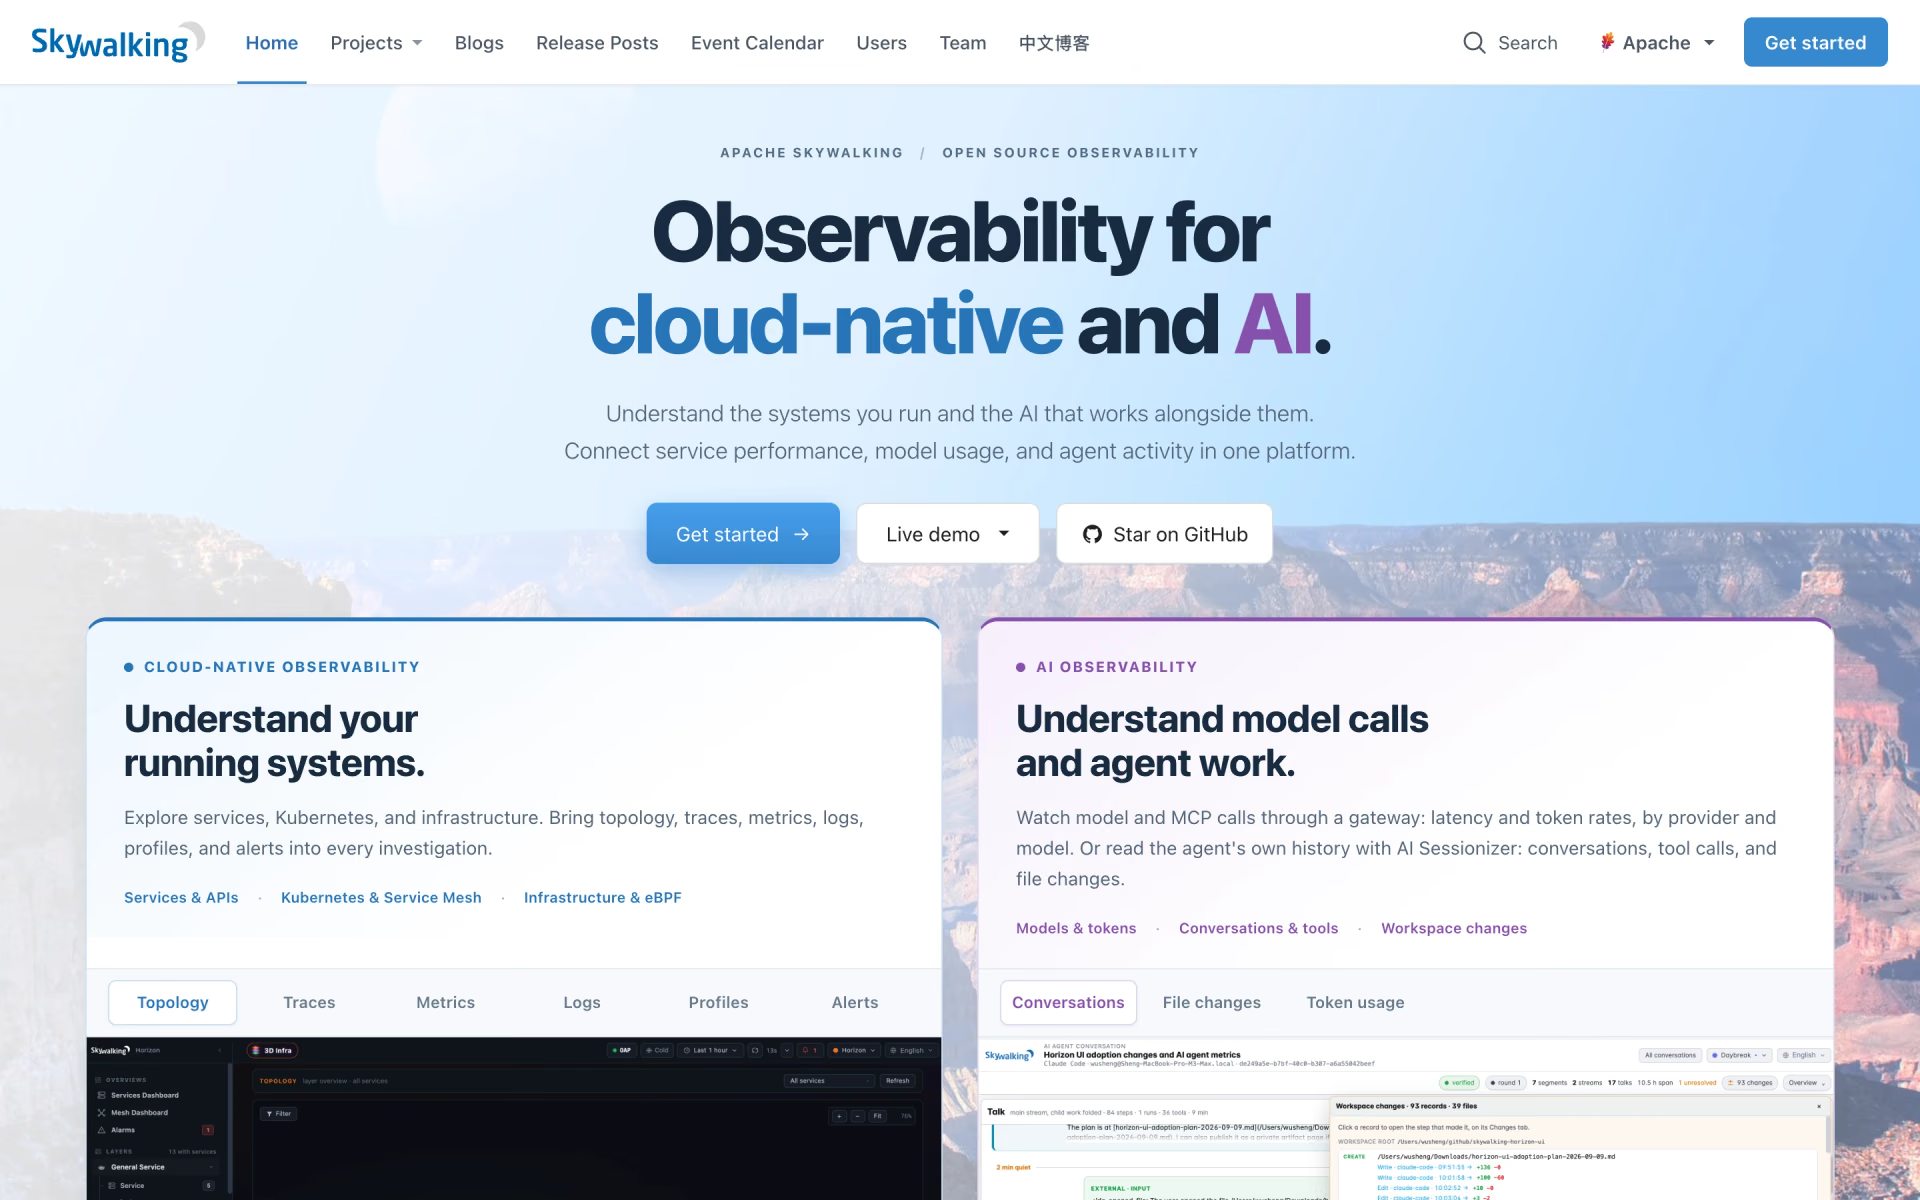
 Apache SkyWalking

 Sevalla