Skip to content

DirectorySkills

Side-by-side bar chart: 1440, made in this run
Run 1Side-by-side bar chart“Compare our target and actual sales for each store with paired bars. Numbers in brief.md.”
Runs in
  • Claude Code
  • Codex
  • Cursor
  • Gemini CLI
  • GitHub Copilot
  • OpenCode
Generates with
Your agent's model
Tested with
Claude Code 2.1.322Claude Sonnet 5.51 real run, 10 Nov
Needs
Node 20+Chrome
Licence
Recaply licence

Side-by-Side Bar Chart

Grouped columns comparing two years for each place, with values on the bars, change in the tooltip and a full table.

$9.99once, yours to keep

Builds a grouped (paired) column chart comparing two series into your own project: six pairs of columns, one pair per park: last year in soft slate, this year in deep teal, the value printed above each teal column; a key above; hovering or arrowing to a park shows both values and the change. Plain HTML, CSS and JavaScript, or matched to React, Next.js, Vue, Svelte, Astro or Tailwind when the project uses them. Comes with a working reference and a check that screenshots it at phone, tablet and desktop widths and flags sideways overflow, text under 12px, missing alt text and names, low contrast, no focus styles, motion that ignores reduced motion, leftover sample words and emoji icons. Use when someone needs to compare two periods, plans or groups across a few categories (this year against last, target against actual), or asks for grouped bars, side-by-side columns or a comparison chart.

By RecaplyUpdated 12 Nov

Install Side-by-Side Bar Chart

After the download, ask your agent to add it, or run the line yourself.

Read https://recaply.co/skills/side-by-side-bar-chart/install.md and follow it to install the side-by-side-bar-chart skill from side-by-side-bar-chart.zip.

Paste it into your agent. It reads our install steps, finds the ZIP you downloaded and adds the skill for you.

New to skills? How to install a skill

Similar skills

All 735 skills

Who Side-by-Side Bar Chart is for

What you get

  • One HTML file with its CSS inside: no build step, no framework
  • A grouped (paired) column chart comparing two series
  • Checked at phone and desktop widths

Good fit

  • When someone needs to compare two periods, plans or groups across a few categories

Not for

  • An app with a backend, sign-in or a database
  • Copying another company's site

About this skill

You say

Compare our target and actual sales for each store with paired bars. Numbers in brief.md.

It said back

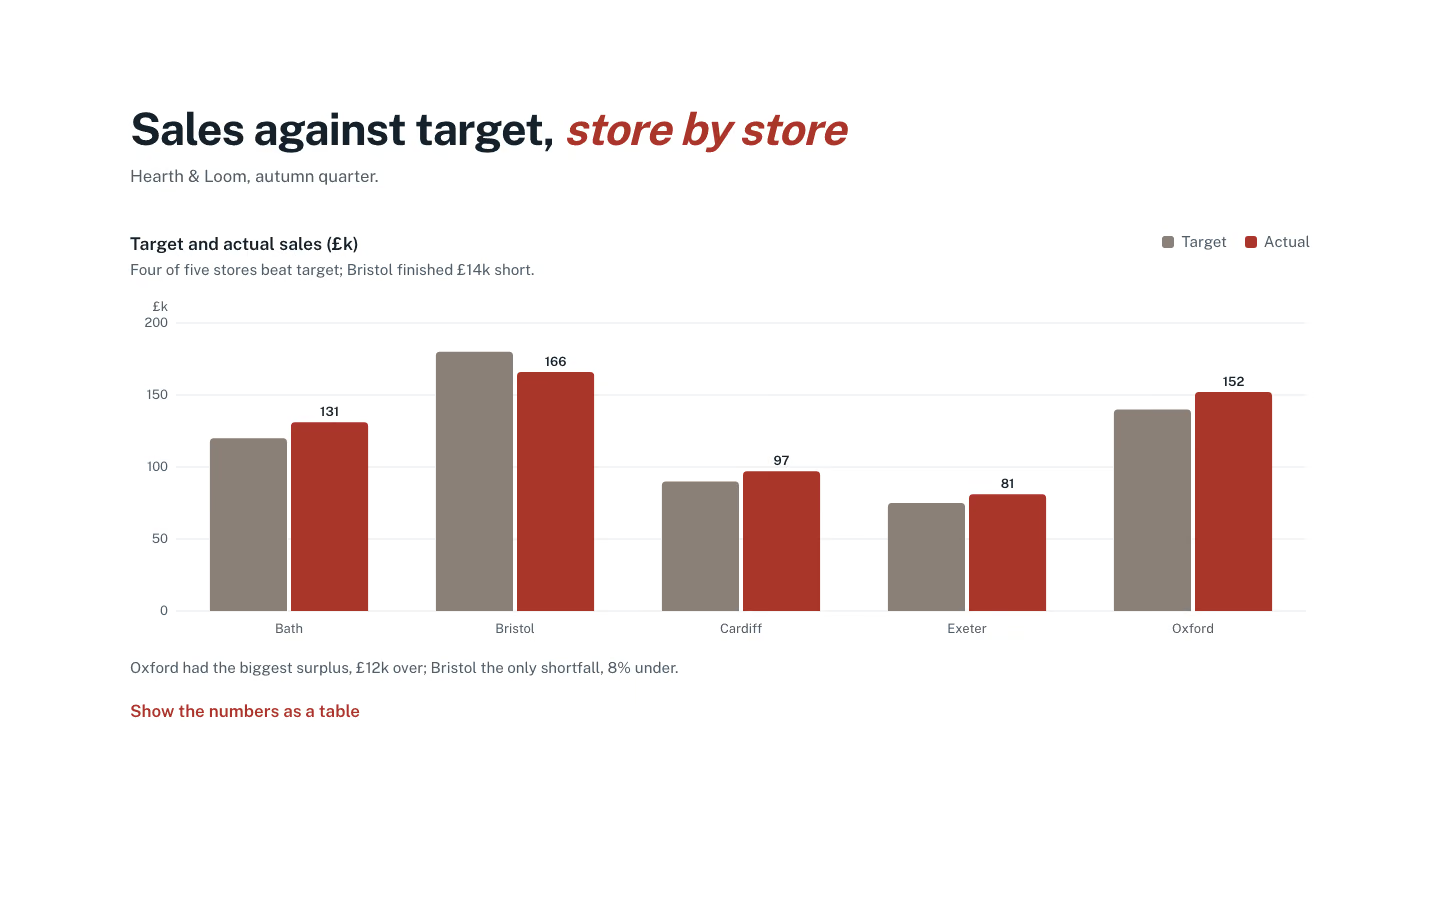
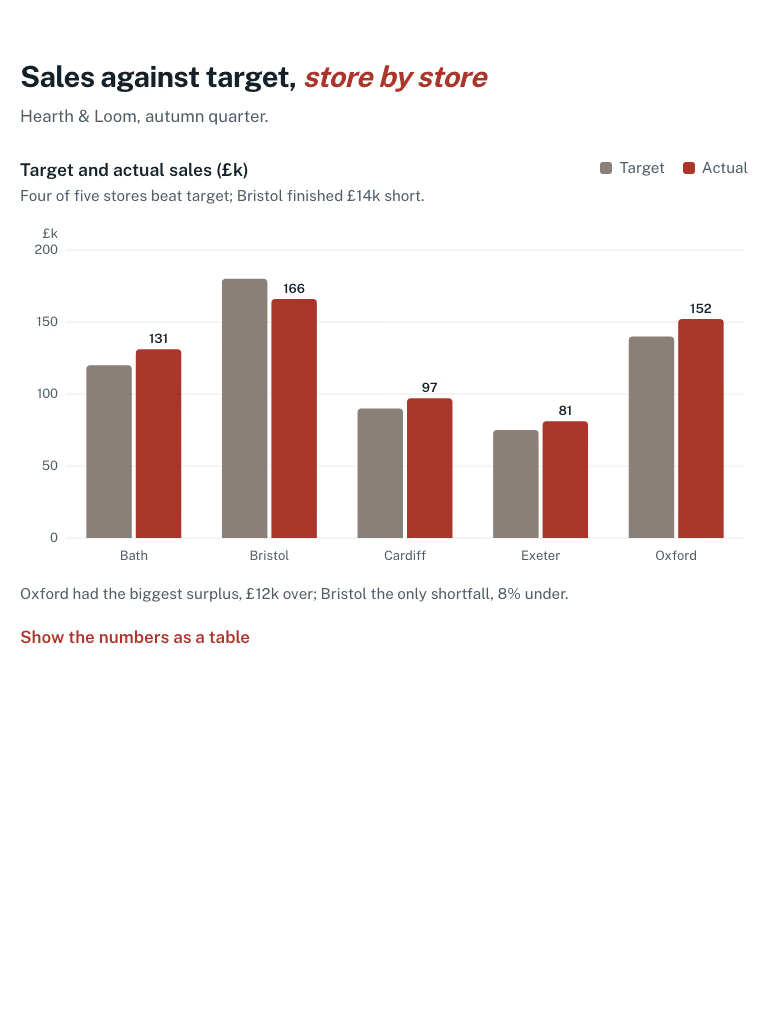
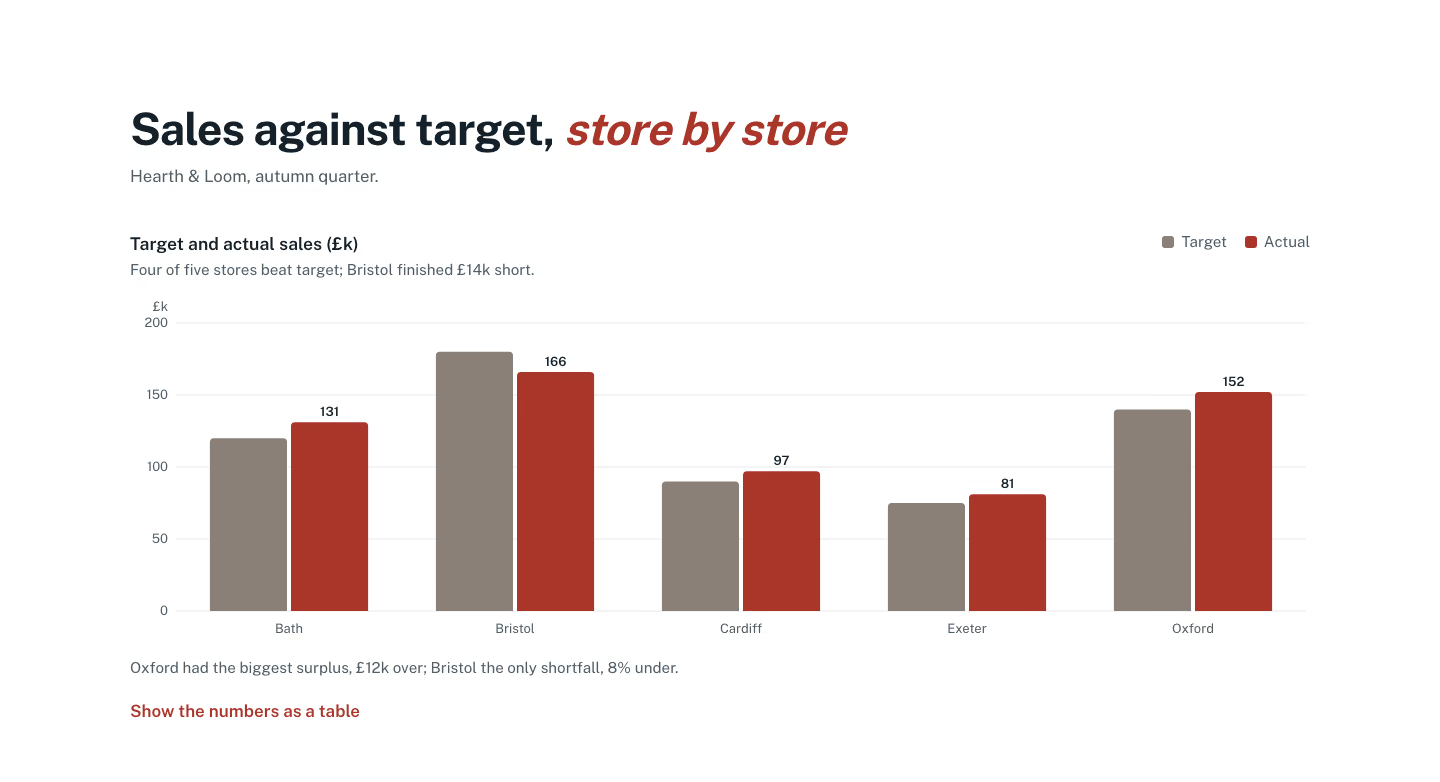
I built the chart as a plain HTML page with a pair of columns for each of the five stores. The skill's check passes at 390, 768 and 1440 px. It covers overflow, small text, names, contrast, focus, motion and script errors. I looked at the 390 and 1440 screenshots and both read cleanly. I didn't open the 768 one.

  • Colours: target is warm grey (#8A8077) and actual is brick red (#A8372A). The actual value is printed above each red column.
  • Tooltip: hovering or arrowing to a store shows its actual and target figures and "£Nk over target" or "£Nk under target". Over is in green and under is in red.
  • Screen readers: a live region reads the same figures. A "Show the numbers as a table" toggle sits below the chart.
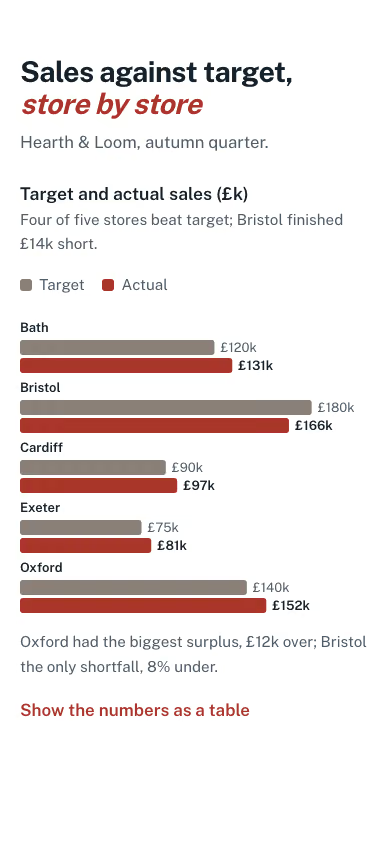
  • Phones: under 560px the chart switches to one row per store, with the target and actual bars and their values.
  • Wording I wrote: the heading "Sales against target, store by store" and the line "Four of five stores beat target; Bristol finished £14k short." Bristol was £14k short and the other four stores beat target. The summary under the chart says Oxford had the biggest surplus, £12k over. Change any of these if you'd prefer different wording.
Show more

What it did in run 1

  1. side-by-side-bar-chart
  2. ./brief.md
  3. cd .; ls -a; S=.claude/skills/side-by-side-bar-chart; ls $S $S/reference; cat $S/reference/index.html $S/reference/style.css $S/reference/script.js
  4. cd .; ls -a; cat .claude/skills/side-by-side-bar-chart/reference/index.html .claude/skills/side-by-side-bar-chart/reference/style.css .claude/skills/side-by-side-bar-chart/reference/script.js
  5. cd .; R=.claude/skills/side-by-side-bar-chart/reference sed -e 's/--last:#7D8B99/--last:#8A8077/; s/--now:#0F766E/--now:#A8372A/; s/--accent:#0F766E/--accent:#A8372A/; s/--em:#0F766E/--em:#A8372A/; s/--good:#0F766E/--good:#1F7A4D/' $R/style.css > style.css echo '.d-tip-over{color:#8FE0B0}.d-tip-under{color:#FFB4A8}' >> style.css cat > index.html <<'E' <!doctype html> <html lang="en"> <head> <meta charset="utf-8"> <meta name="viewport" content="width=device-width, initial-scale=1"> <title>Target vs actual sales by store</title> <link rel="preconnect" href="https://fonts.googleapis.com"> <link rel="preconnect" href="https://fonts.gstatic.com" crossorigin> <link rel="stylesheet" href="https://fonts.googleapis.com/css2?family=Public+Sans:wght@400;500;600;700&display=swap"> <link rel="stylesheet" href="style.css"> </head> <body> <main id="main"> <section class="d-sec" aria-labelledby="h"><div class="sec-head"><h2 id="h">Sales against target, <em>store by store</em></h2><p class="sub">Hearth &amp; Loom, autumn quarter.</p></div><div class="wrap"><div class="pc"> <div class="d-top"><div><p class="d-title">Target and actual sales (£k)</p><p class="d-sub">Four of five stores beat target; Bristol finished £14k short.</p></div><p class="key"><span style="--c:var(--last)"><i></i>Target</span><span style="--c:var(--now)"><i></i>Actual</span></p></div> <div class="plot-wrap"><div class="plot pc-plot" tabindex="0" role="group" aria-label="Target and actual sales by store, in thousands of pounds. Use the left and right arrow keys to read each store." aria-describedby="pc-sum"></div><p class="sr-only" aria-live="polite" data-live></p></div> <p class="d-hint" id="pc-sum">Oxford had the biggest surplus, £12k over; Bristol the only shortfall, 8% under.</p> <details class="d-table"><summary>Show the numbers as a table</summary><div class="dt-wrap"><table class="dt"><caption class="sr-only">Target and actual sales by store, £k</caption><thead><tr><th scope="col">Store</th><th scope="col">Target</th><th scope="col">Actual</th><th scope="col">Difference</th></tr></thead><tbody> <tr><th scope="row">Bath</th><td>120</td><td>131</td><td>+11</td></tr> <tr><th scope="row">Bristol</th><td>180</td><td>166</td><td>-14</td></tr> <tr><th scope="row">Cardiff</th><td>90</td><td>97</td><td>+7</td></tr> <tr><th scope="row">Exeter</th><td>75</td><td>81</td><td>+6</td></tr> <tr><th scope="row">Oxford</th><td>140</td><td>152</td><td>+12</td></tr> </tbody></table></div></details> <script type="application/json" id="pc-data">{"P":["Bath","Bristol","Cardiff","Exeter","Oxford"],"a":[120,180,90,75,140],"b":[131,166,97,81,152]}</script> </div></div></section> </main> <script src="script.js" defer></script> </body> </html> E python3 - <<'E' import re s=open('.claude/skills/side-by-side-bar-chart/reference/script.js').read() i=s.index('// Shared chart helpers') s=s[i:] s=s.replace("fill: '#0F766E'","fill: '#A8372A'") # change(): difference in £k s=re.sub(r"const change = function \(i\) \{.*?\};\n","const change = function (i) { const d = D2.b[i] - D2.a[i]; return d === 0 ? 'on target' : '£' + Math.abs(d) + 'k ' + (d > 0 ? 'over' : 'under') + ' target'; };\nconst tipChange = function (i) { const d = D2.b[i] - D2.a[i]; return d === 0 ? 'On target' : '<span class=\"' + (d > 0 ? 'd-tip-over' : 'd-tip-under') + '\">£' + Math.abs(d) + 'k ' + (d > 0 ? 'over' : 'under') + ' target</span>'; };\n",s,flags=re.S) s=s.replace("'<b>' + D2.P[i] + '</b>2026: ' + fmt(D2.b[i]) + '<br>2025: ' + fmt(D2.a[i]) + '<br>' + change(i).replace(/^./, function (c) { return c.toUpperCase(); })","'<b>' + D2.P[i] + '</b>Actual: £' + fmt(D2.b[i]) + 'k<br>Target: £' + fmt(D2.a[i]) + 'k<br>' + tipChange(i)") s=s.replace("D2.P[i] + ': 2026 ' + fmt(D2.b[i]) + ' visitors, 2025 ' + fmt(D2.a[i]) + ', ' + change(i)","D2.P[i] + ': actual £' + fmt(D2.b[i]) + 'k, target £' + fmt(D2.a[i]) + 'k, ' + change(i)") s="document.documentElement.classList.add('js');\n"+s open('script.js','w').write(s) E grep -c "2026\|visitors" script.js; node .claude/skills/side-by-side-bar-chart/scripts/check.mjs index.html --out check 2>&1 | tail -25
  6. cd .; sed -e 's/--last:#7D8B99/--last:#8A8077/' -e 's/--now:#0F766E/--now:#A8372A/' -e 's/--accent:#0F766E/--accent:#A8372A/' -e 's/--em:#0F766E/--em:#A8372A/' -e 's/--good:#0F766E/--good:#1F7A4D/' .claude/skills/side-by-side-bar-chart/reference/style.css > style.css; printf '.d-tip-over{color:#8FE0B0}\n.d-tip-under{color:#FFB4A8}\n' >> style.css; tail -3 style.css | cut -c1-80
  7. ./index.html
  8. ./style.css
  9. ./script.js
  10. node .claude/skills/side-by-side-bar-chart/scripts/check.mjs index.html --out check 2>&1 | tail -30
  11. ./check/1440.png
  12. ./check/390.png
  13. Done

10 Nov 2026 · Claude Code 2.1.322 with Claude Sonnet 5.5 · 1 min 14 s · $0.25 of API use

Questions

Is Side-by-Side Bar Chart free?

No. Side-by-Side Bar Chart costs $9.99 once and stays in your Recaply account, or it comes with the Recaply plan ($19.99 a month), which opens every premium skill and prompt.

Which agents can use Side-by-Side Bar Chart?

Claude Code, Codex, Cursor, Gemini CLI, GitHub Copilot and OpenCode.

What do I get when I buy Side-by-Side Bar Chart?

A ZIP of the whole skill folder (34 KB): the SKILL.md your agent follows and its 6 other files, the references, templates and scripts it uses. You download it from this page whenever you need it, and install it in Claude Code, Codex, Cursor, Gemini CLI, GitHub Copilot and OpenCode. The Recaply plan opens it too, with every other premium skill and prompt.

How do I install Side-by-Side Bar Chart?

Buy it, then download the ZIP from this page. For Claude Code, unzip it into .claude/skills/ in your project. For Codex, Cursor and Gemini CLI, unzip it and run npx skills add ./side-by-side-bar-chart with your agent's flag.

What do I get from Side-by-Side Bar Chart?

One HTML file with its CSS inside: no build step, no framework. A grouped (paired) column chart comparing two series. Checked at phone and desktop widths.

What does Side-by-Side Bar Chart need?

Node 20+ and Chrome, and no API key. Each use costs nothing beyond your agent.

How big is Side-by-Side Bar Chart?

7 files, about 21,840 tokens in all. The SKILL.md is about 2,149 tokens, and your agent reads it only when the job fits.

What does a run cost?

Our 1 runs took 1 min 14 s to 1 min 14 s and $0.25 to $0.25 of API use each, in Claude Code with claude-sonnet-5-5. On a Claude plan, a run counts toward your usage instead.

Do I have to name Side-by-Side Bar Chart to use it?

Type /side-by-side-bar-chart first to make sure it loads. Without it, Claude Code may judge a small job simple enough to do without the skill.