 Video
Research Report Hero


 Editorial hero for a report
 Claude CodeCodexCursor
 Gemini CLI
 GitHub Copilot
 OpenCode
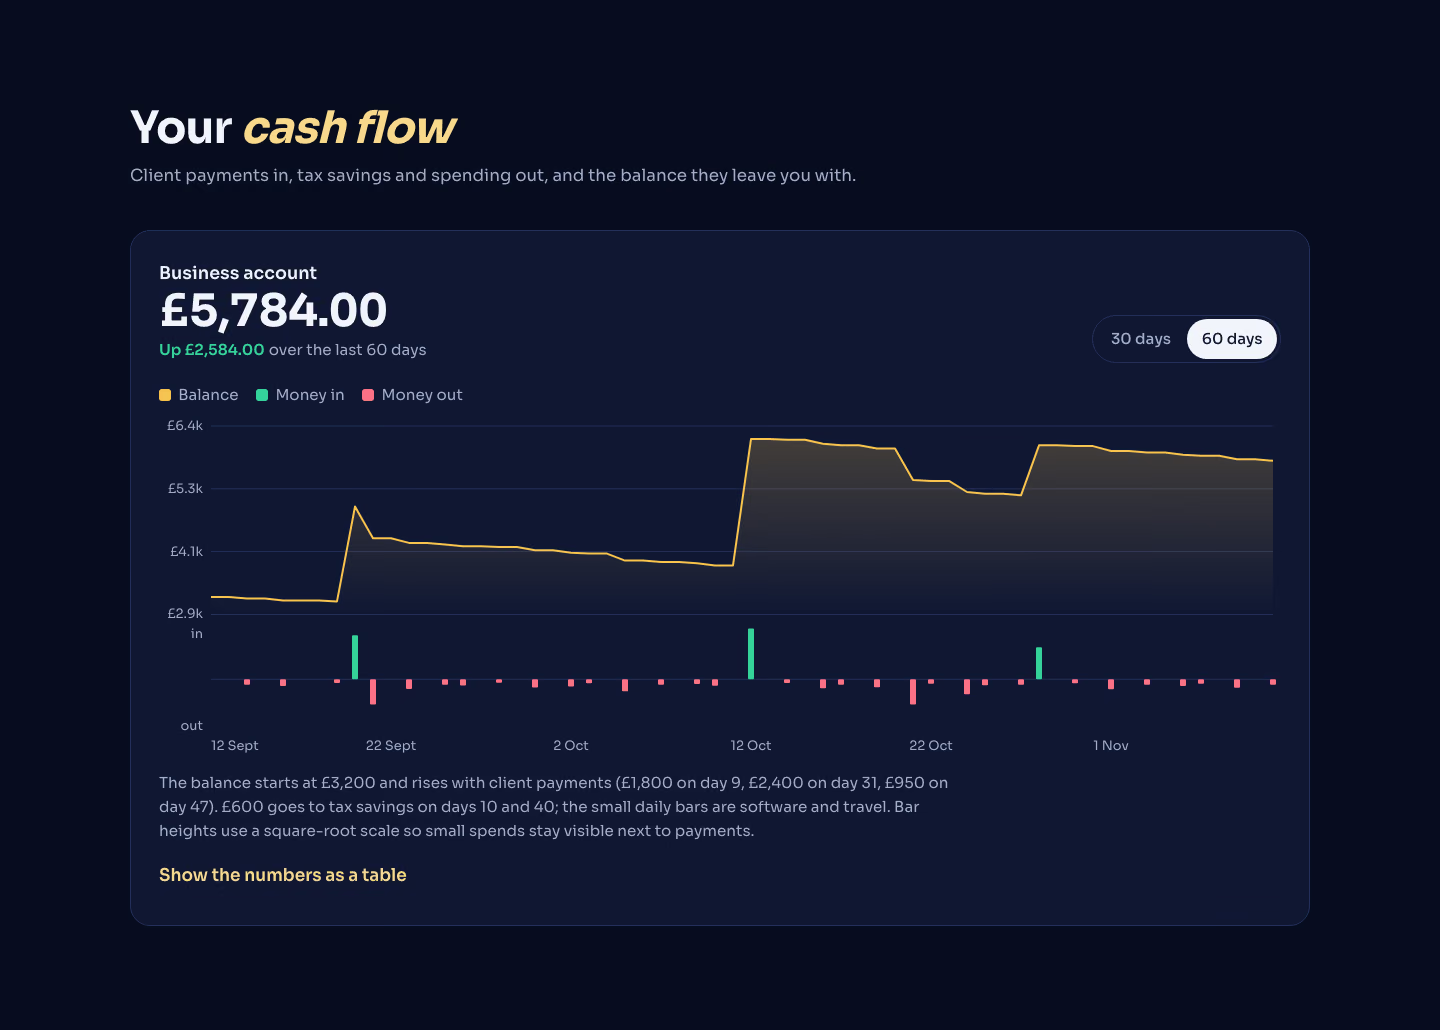
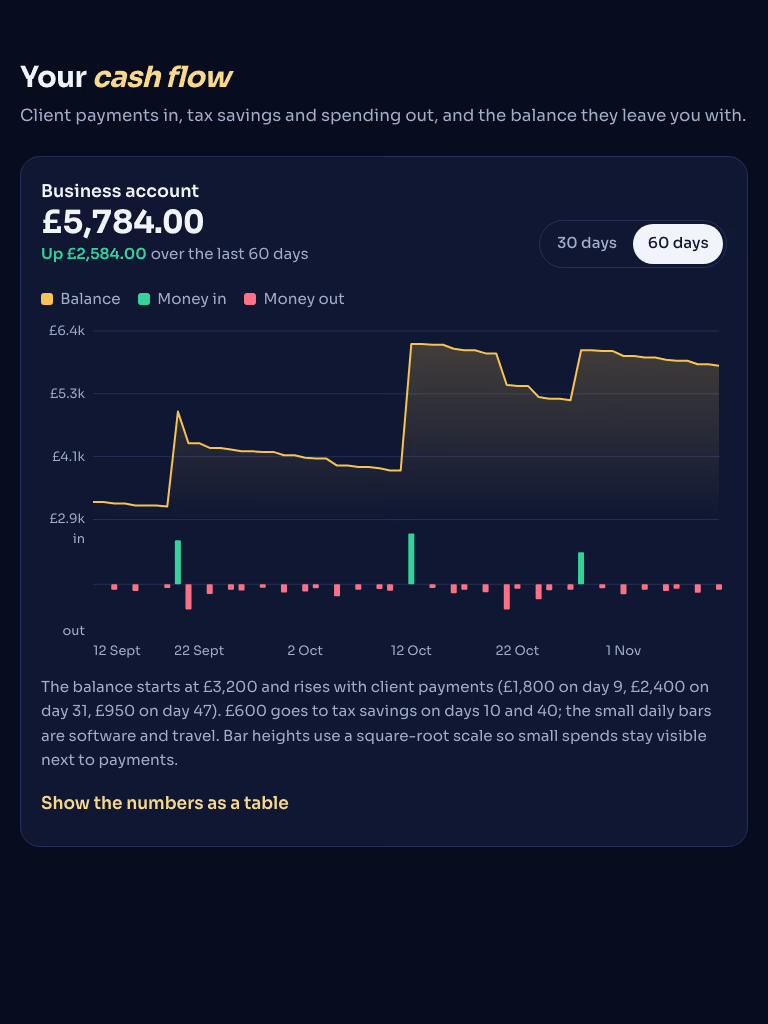
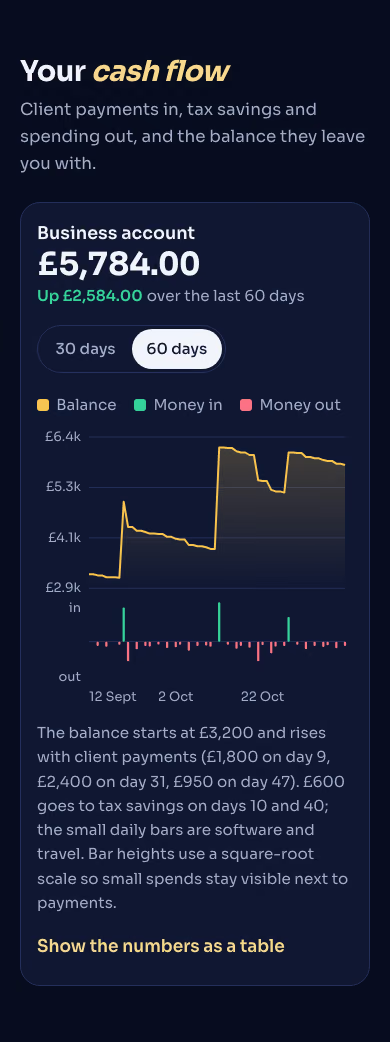
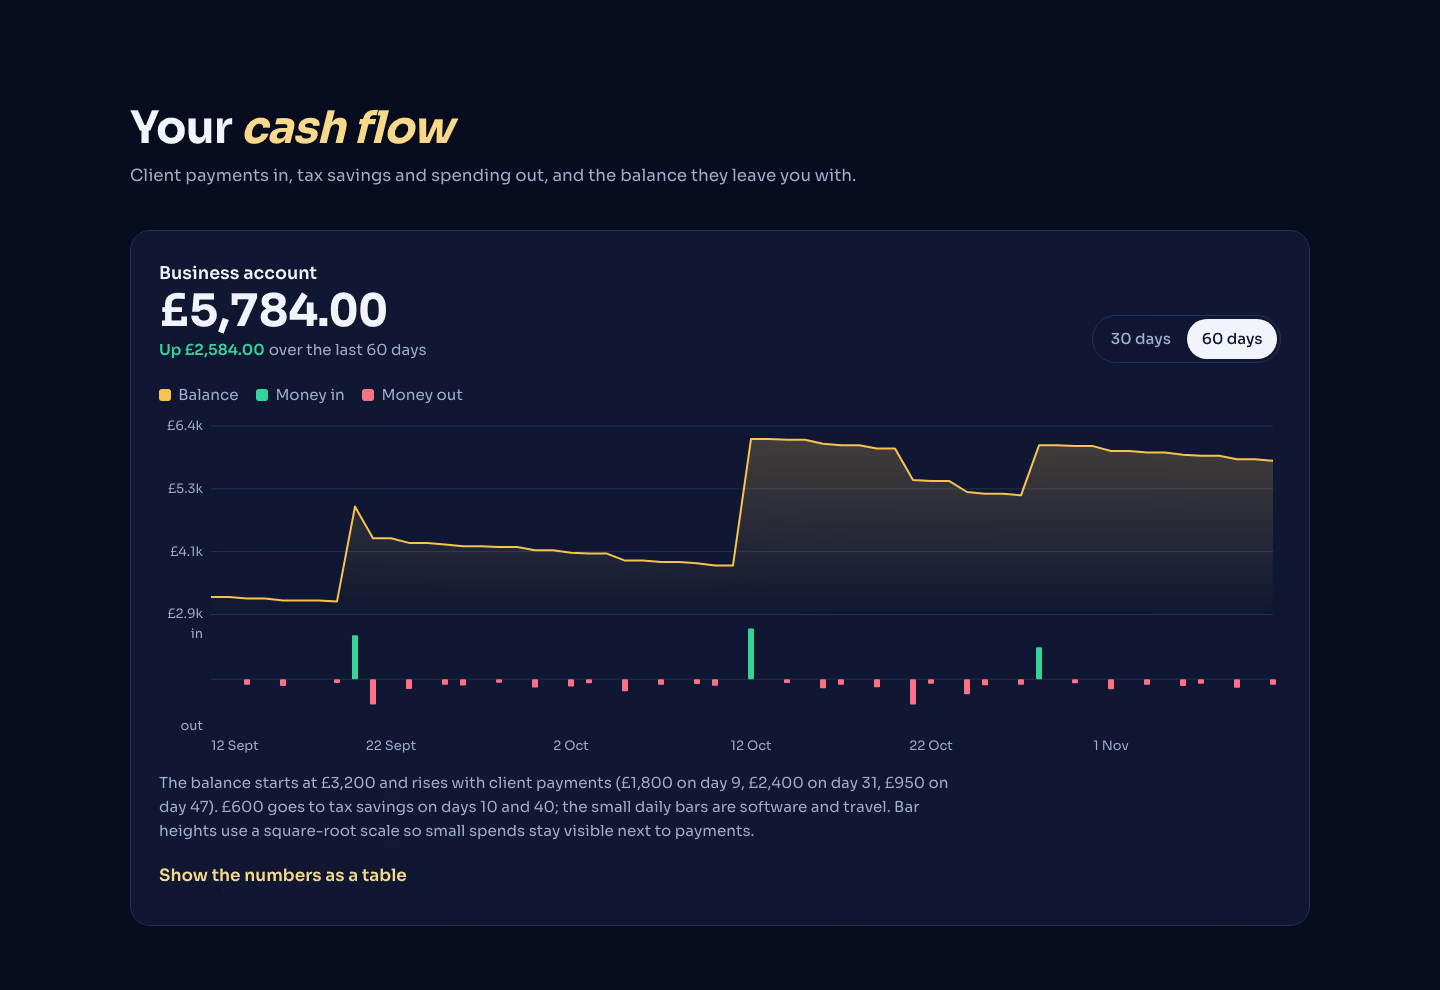
A dark money chart: the balance as a soft line over money in and out shown as bars above and below a zero line.
$9.99once, yours to keep
Payments are non-refundable. See our Terms of service.
Yours. Download it, then add it to your agent.
Builds a dark account-balance chart with money in and out into your own project: a near-black card with the current balance large at the top and a 30 or 90 day switch; a periwinkle balance line with a faint glow fills the upper part; under it, green bars rise for money in and coral bars drop for money out each day; a tooltip shows the day's balance, in and out. Plain HTML, CSS and JavaScript, or matched to React, Next.js, Vue, Svelte, Astro or Tailwind when the project uses them. Comes with a working reference and a check that screenshots it at phone, tablet and desktop widths and flags sideways overflow, text under 12px, missing alt text and names, low contrast, no focus styles, motion that ignores reduced motion, leftover sample words and emoji icons. Use when a banking, budgeting, invoicing or finance app needs to show a balance over time with the flows that moved it, or someone asks for a balance chart, cash-flow chart or dark finance chart.
By RecaplyUpdated 12 Nov
Video
Editorial hero for a report
 Video1 view, 0 downloads
Lavender page for an AI app
 Video
Product page for headphones
 Video
Page with a node-flow hero
You say
Create a dark cash-flow chart for our freelancers' invoicing app. Data in brief.md.
It said back
I built the dark cash-flow chart and it passes the skill's check at 390, 768 and 1440 px. I looked at the 390 px and 1440 px screenshots and they read cleanly. I did not open the 768 px one.
It shows the business account balance over 60 days in a midnight-blue card with a gold balance line. Client payments are green bars above the zero line and money out is coral bars below it. Hovering a day, or using the arrow keys, shows that day's balance, in and out. There is also a "Show the numbers as a table" option.
What it did in run 1
<tr><th scope="row">${d}</th><td>${f(c.at(-1)[1])}</td><td>${f(c.reduce((a,r)=>a+r[2],0))}</td><td>${f(c.reduce((a,r)=>a+r[3],0))}</td></tr>);} const rep=(a,b)=>{if(!html.includes(a))throw a;html=html.replace(a,b)}; rep('<title>Money flow chart</title>','<title>Cash flow – Ledgerly</title>'); html=html.replace(/<meta name="description"[^>]*>/,'<meta name="description" content="Business account balance over 60 days, with client payments in and tax transfers and spending out.">'); html=html.replace(/<section[\s\S]*?<div class="sec-head[\s\S]*?<\/div><div class="wrap">/,'<section class="d-sec dark" id="balance" aria-labelledby="balance-h"><div class="sec-head"><h2 id="balance-h">Your <em>cash flow</em></h2><p class="sub">Client payments in, tax savings and spending out, and the balance they leave you with.</p></div><div class="wrap">'); rep('Everyday account','Business account'); rep('£7,635.00',£${last.toLocaleString('en-GB',{minimumFractionDigits:2})}); rep('Up £935.00',${ch>=0?'Up':'Down'} £${Math.abs(ch).toLocaleString('en-GB',{minimumFractionDigits:2})}); rep('over the last 30 days','over the last 60 days'); rep('<button type="button" data-days="30" aria-pressed="true">30 days</button><button type="button" data-days="90" aria-pressed="false">90 days</button>','<button type="button" data-days="30" aria-pressed="false">30 days</button><button type="button" data-days="60" aria-pressed="true">60 days</button>'); rep('Balance with daily money in and out.','Business account balance with daily money in and out.'); html=html.replace(/<p class="d-hint"[^>]*>[\s\S]*?<\/p>/,'<p class="d-hint" id="bl-sum">The balance starts at £3,200 and rises with client payments (£1,800 on day 9, £2,400 on day 31, £950 on day 47). £600 goes to tax savings on days 10 and 40; the small daily bars are software and travel. Bar heights use a square-root scale so small spends stay visible next to payments.</p>'); html=html.replace(/<tbody>[\s\S]*?<\/tbody>/,'<tbody>'+wk.join('')+'</tbody>'); rep('Balance at the end of each week','Balance at the end of each 7-day block'); rep('<th scope="col">Week ending</th>','<th scope="col">Period ending</th>'); html=html.replace(/<script type="application\/json" id="bl-data">[\s\S]*?<\/script>/,'<script type="application/json" id="bl-data">'+JSON.stringify(rows)+'</script>'); fs.writeFileSync('index.html',html); EOF node tools/gen.mjs && sed -i '' 's/let days = 30/let days = 60/' script.js && sed -i '' -e 's/--bg:#0B0D12/--bg:#070C1F/;s/--surface:#13161E/--surface:#0F1733/;s/--ink:#F1F3F8/--ink:#F2F4FB/;s/--muted:#A2A9BA/--muted:#A3AECB/;s/--line:#262B38/--line:#243059/;s/--accent:#A5B4FC/--accent:#F5C451/;s/--on-accent:#0B0D12/--on-accent:#070C1F/;s/--em:#C7D2FE/--em:#F8D98A/;s/--tip-ink:#0B0D12/--tip-ink:#070C1F/;s/--tip-bg:#F1F3F8/--tip-bg:#F2F4FB/' style.css && grep -c 60 index.html && node .claude/skills/money-flow-chart/scripts/check.mjs index.html --out check 2>&1 | tail -30No. Money Flow Chart costs $9.99 once and stays in your Recaply account, or it comes with the Recaply plan ($19.99 a month), which opens every premium skill and prompt.
Claude Code, Codex, Cursor, Gemini CLI, GitHub Copilot and OpenCode.
A ZIP of the whole skill folder (35 KB): the SKILL.md your agent follows and its 6 other files, the references, templates and scripts it uses. You download it from this page whenever you need it, and install it in Claude Code, Codex, Cursor, Gemini CLI, GitHub Copilot and OpenCode. The Recaply plan opens it too, with every other premium skill and prompt.
Buy it, then download the ZIP from this page. For Claude Code, unzip it into .claude/skills/ in your project. For Codex, Cursor and Gemini CLI, unzip it and run npx skills add ./money-flow-chart with your agent's flag.
One HTML file with its CSS inside: no build step, no framework. A dark account-balance chart with money in and out. Checked at phone and desktop widths.
Node 20+ and Chrome, and no API key. Each use costs nothing beyond your agent.
7 files, about 22,823 tokens in all. The SKILL.md is about 2,179 tokens, and your agent reads it only when the job fits.
Our 1 runs took 1 min 7 s to 1 min 7 s and $0.22 to $0.22 of API use each, in Claude Code with claude-sonnet-5-5. On a Claude plan, a run counts toward your usage instead.
Type /money-flow-chart first to make sure it loads. Without it, Claude Code may judge a small job simple enough to do without the skill.