Skip to content

DirectorySkills

Live signal chart: 1440, made in this run
Run 1Live signal chart“Add a live vibration spectrum panel for one of our factory machines. Details in brief.md.”
Runs in
  • Claude Code
  • Codex
  • Cursor
  • Gemini CLI
  • GitHub Copilot
  • OpenCode
Generates with
Your agent's model
Tested with
Claude Code 2.1.322Claude Sonnet 5.51 real run, 10 Nov
Needs
Node 20+Chrome
Licence
Recaply licence

Live Signal Chart

A live audio spectrum panel: 48 frequency bars with falling peak marks, channel switch, freeze and a peak readout.

$9.99once, yours to keep

Builds a live spectrum analyser chart (levels by frequency) into your own project: a dark instrument panel: channel switch and Freeze button at the top, a readout of the loudest band, then 48 bars from 20 Hz to 20 kHz on a log scale against a -60 to 0 dB grid; bars turn amber and red near the top and leave thin peak marks that fall slowly. Plain HTML, CSS and JavaScript, or matched to React, Next.js, Vue, Svelte, Astro or Tailwind when the project uses them. Comes with a working reference and a check that screenshots it at phone, tablet and desktop widths and flags sideways overflow, text under 12px, missing alt text and names, low contrast, no focus styles, motion that ignores reduced motion, leftover sample words and emoji icons. Use when an audio, podcast, radio, music, sensor or machine-monitoring product needs a live frequency or level display, or someone asks for a spectrum analyser, equaliser bars or a live levels chart.

By RecaplyUpdated 12 Nov

Install Live Signal Chart

After the download, ask your agent to add it, or run the line yourself.

Read https://recaply.co/skills/live-signal-chart/install.md and follow it to install the live-signal-chart skill from live-signal-chart.zip.

Paste it into your agent. It reads our install steps, finds the ZIP you downloaded and adds the skill for you.

New to skills? How to install a skill

Similar skills

All 735 skills

Who Live Signal Chart is for

What you get

  • One HTML file with its CSS inside: no build step, no framework
  • A live spectrum analyser chart (levels by frequency)
  • Checked at phone and desktop widths

Good fit

  • When an audio, podcast, radio, music, sensor or machine-monitoring product needs a live frequency or level display

Not for

  • An app with a backend, sign-in or a database
  • Copying another company's site

About this skill

You say

Add a live vibration spectrum panel for one of our factory machines. Details in brief.md.

It said back

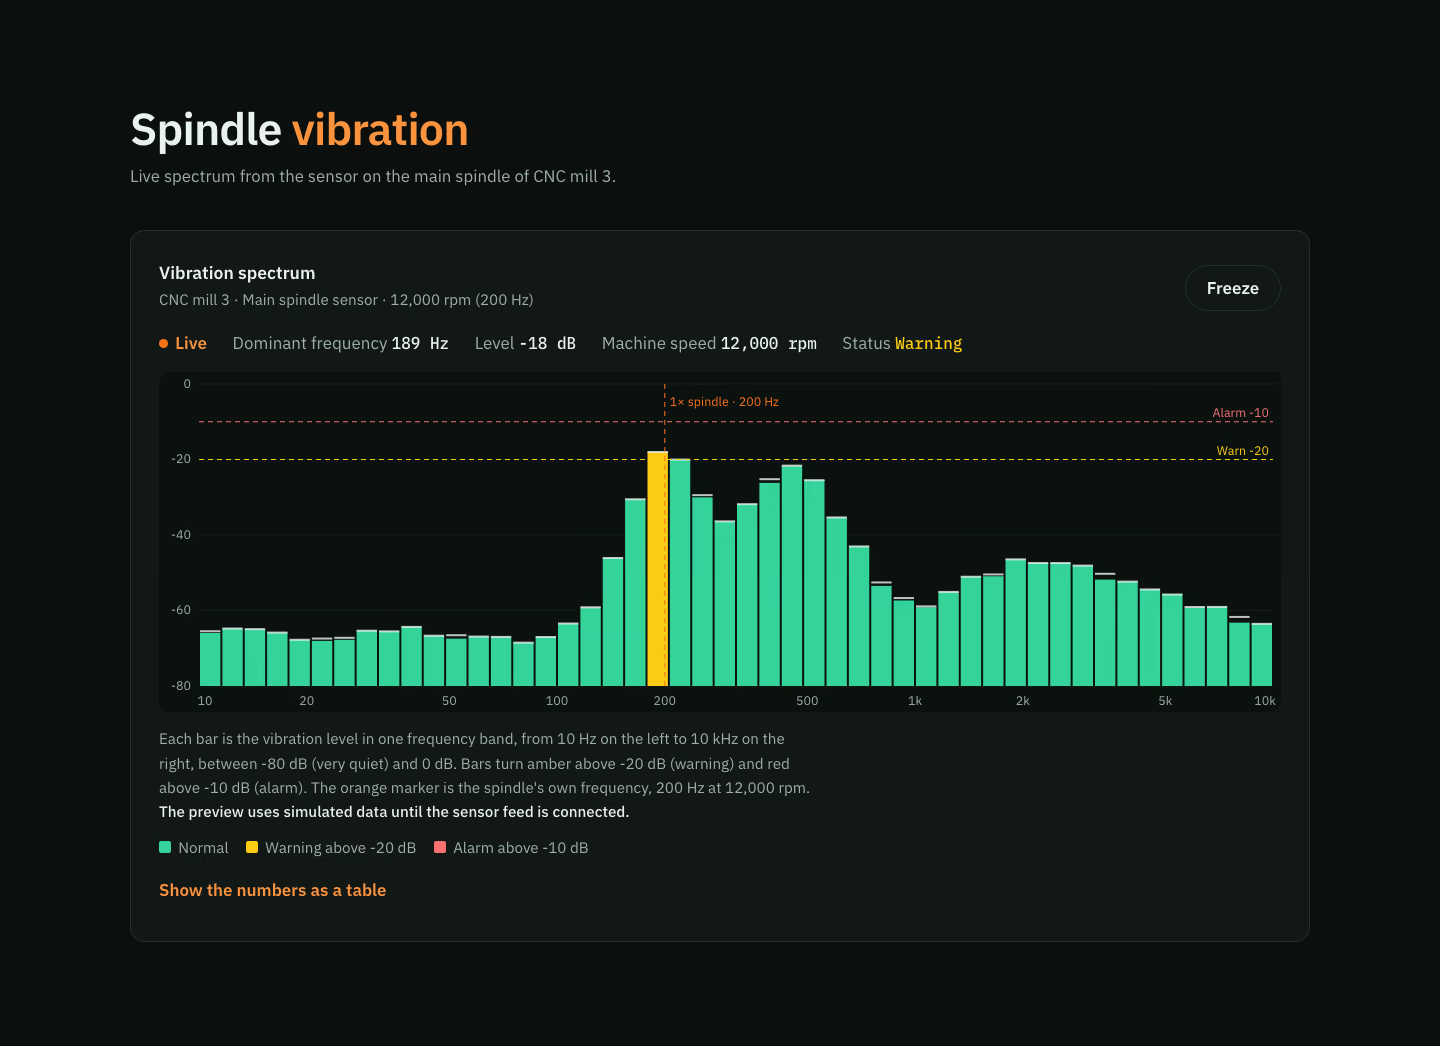
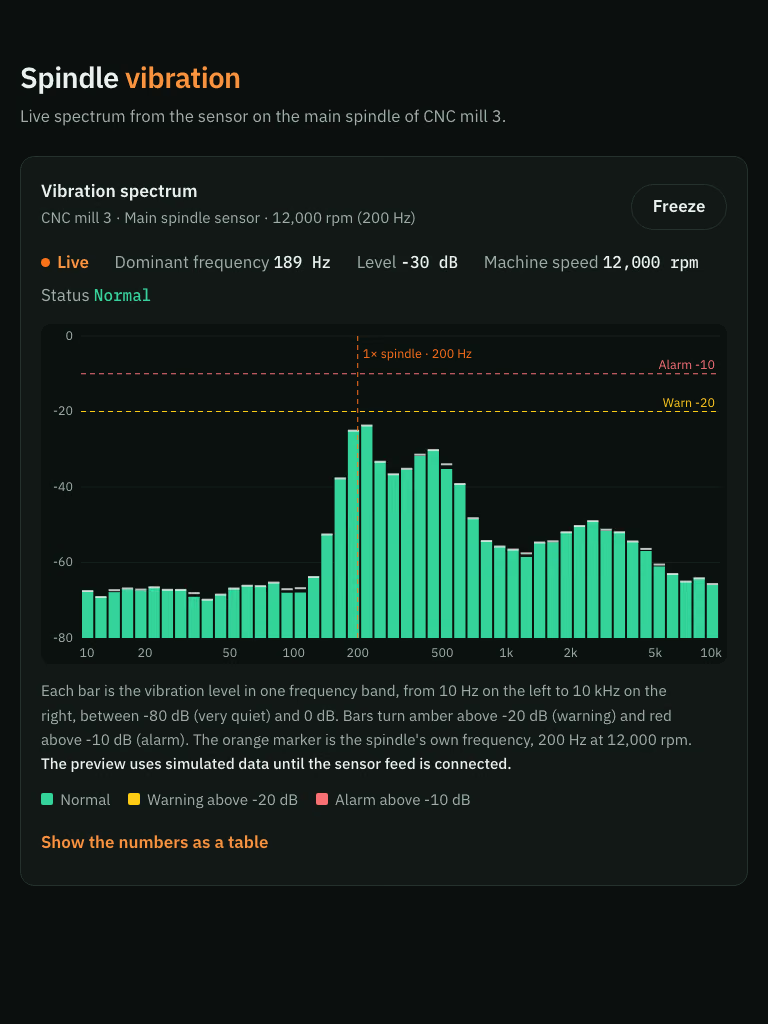
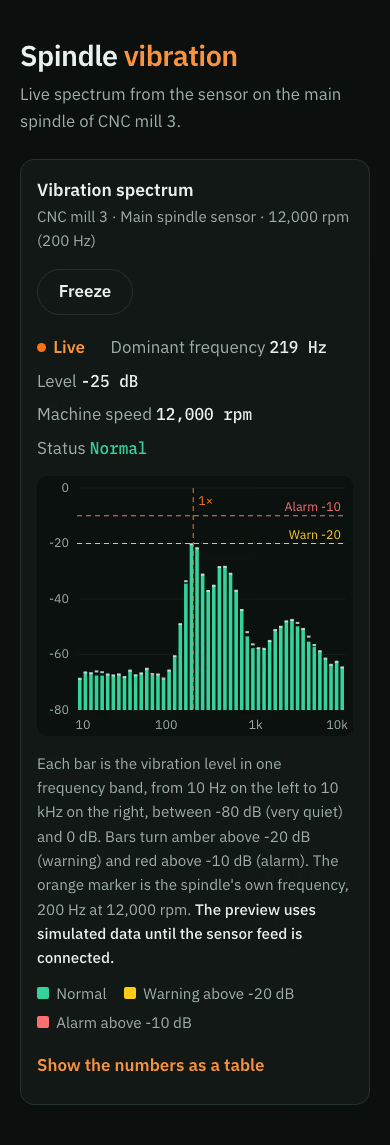
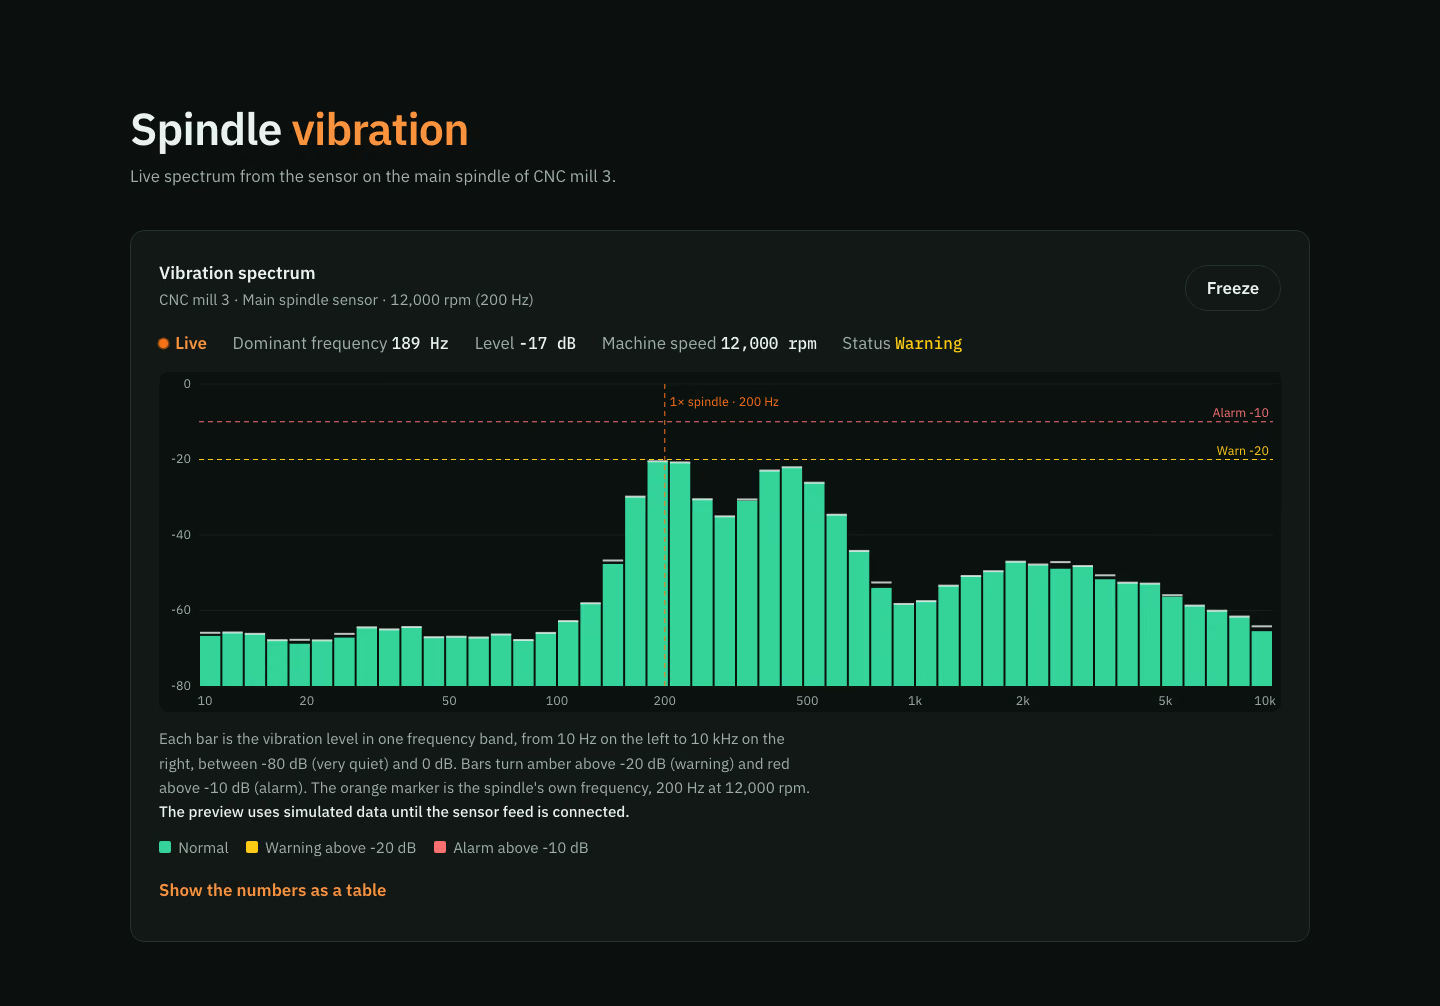
The CNC mill 3 spindle panel is built, and it passes the skill's check at 390, 768 and 1440 px. The check covers overflow, text size, contrast, focus, motion and script errors. I read the screenshots and the 1× label reads clearly now. I didn't open the table or press Freeze.

Files (new, in the work folder):

  • index.html
  • style.css
  • script.js
  • Screenshots: check/390.png, check/768.png, check/1440.png
Show more

What it did in run 1

  1. ./brief.md
  2. live-signal-chart
  3. ls -la .
  4. cd ./.claude/skills/live-signal-chart && ls -R . | head -30 && cat reference/index.html reference/style.css reference/script.js
  5. cd . && cat > index.html <<'EOF' <!doctype html> <html lang="en"> <head> <meta charset="utf-8"> <meta name="viewport" content="width=device-width, initial-scale=1"> <title>Spindlewatch · CNC mill 3 vibration spectrum</title> <meta name="description" content="Live vibration spectrum of the main spindle on CNC mill 3, 10 Hz to 10 kHz, with warning and alarm levels."> <link rel="preconnect" href="https://fonts.googleapis.com"> <link rel="preconnect" href="https://fonts.gstatic.com" crossorigin> <link rel="stylesheet" href="https://fonts.googleapis.com/css2?family=IBM+Plex+Sans:wght@400;500;600&family=IBM+Plex+Mono:wght@500&display=swap"> <link rel="stylesheet" href="style.css"> </head> <body> <a class="skip" href="#main">Skip to content</a> <main id="main"> <section class="d-sec" id="monitor" aria-labelledby="monitor-h"> <div class="sec-head"><h2 id="monitor-h">Spindle <em>vibration</em></h2><p class="sub">Live spectrum from the sensor on the main spindle of CNC mill 3.</p></div> <div class="wrap"><div class="d-card sm"> <div class="d-top"> <div><p class="d-title">Vibration spectrum</p><p class="d-sub">CNC mill 3 · Main spindle sensor · 12,000 rpm (200 Hz)</p></div> <div class="sm-ctl"><button class="sm-freeze" type="button" aria-pressed="false" data-freeze>Freeze</button></div> </div> <p class="sm-read"> <span class="sm-live"><i aria-hidden="true"></i><span data-state>Live</span></span> <span>Dominant frequency <b data-peak>200 Hz</b></span> <span>Level <b data-level>-30 dB</b></span> <span>Machine speed <b>12,000 rpm</b></span> <span>Status <b data-status>Normal</b></span> </p> <div class="plot sm-plot"><canvas aria-hidden="true"></canvas></div> <p class="d-hint" id="sm-sum">Each bar is the vibration level in one frequency band, from 10 Hz on the left to 10 kHz on the right, between -80 dB (very quiet) and 0 dB. Bars turn amber above -20 dB (warning) and red above -10 dB (alarm). The dashed marker shows the spindle's own frequency, 200 Hz at 12,000 rpm. <strong>Preview uses simulated data until the sensor feed is connected.</strong></p> <p class="sm-key" aria-hidden="true"><span><i style="--c:var(--good)"></i>Normal</span><span><i style="--c:var(--warn)"></i>Warning above -20 dB</span><span><i style="--c:var(--bad)"></i>Alarm above -10 dB</span></p> <details class="d-table"><summary>Show the numbers as a table</summary><div class="dt-wrap"><table class="dt"><caption class="sr-only">Snapshot of spindle vibration, level by frequency band</caption><thead><tr><th scope="col">Band</th><th scope="col">Level</th><th scope="col">Status</th></tr></thead><tbody data-rows></tbody></table></div></details> </div></div> </section> </main> <script src="script.js" defer></script> </body> </html> EOF cat > style.css <<'EOF' :root{--bg:#0B0F0E;--surface:#111816;--ink:#E8F2EE;--muted:#9DB0A8;--line:#24322D;--brand:#F97316;--accent:#F97316;--on-accent:#1A0A00;--em:#FB923C;--good:#34D399;--warn:#FACC15;--bad:#F87171;--font:'IBM Plex Sans',system-ui,sans-serif} *,*::before,*::after{box-sizing:border-box} html{-webkit-text-size-adjust:100%} body{margin:0;background:var(--bg);color:var(--ink);font-family:var(--font);font-size:1.0625rem;line-height:1.6;-webkit-font-smoothing:antialiased} canvas{max-width:100%;display:block} h2{font-family:var(--font);line-height:1.1;margin:0;text-wrap:balance;font-weight:600} p{margin:0} button{font:inherit;color:inherit} :focus-visible{outline:3px solid var(--accent);outline-offset:3px;border-radius:4px} .wrap{width:min(100% - 40px,1180px);margin-inline:auto} .skip{position:absolute;left:-9999px;top:12px;z-index:100;background:var(--ink);color:var(--bg);padding:.6rem 1rem;border-radius:8px;text-decoration:none} .skip:focus{left:12px} .sr-only{position:absolute!important;width:1px;height:1px;padding:0;margin:-1px;overflow:hidden;clip:rect(0,0,0,0);white-space:nowrap;border:0} .d-sec{padding-block:clamp(40px,8vw,104px)} .sec-head{width:min(100% - 40px,1180px);margin:0 auto clamp(24px,3.4vw,40px)} .sec-head h2{font-size:clamp(1.8rem,3.8vw,2.8rem);letter-spacing:-.02em} .sec-head h2 em{font-style:normal;color:var(--em)} .sec-head .sub{color:var(--muted);margin-top:.6rem;max-width:60ch;font-size:1.05rem} .d-card{background:var(--surface);border:1px solid var(--line);border-radius:14px;padding:clamp(16px,2.6vw,28px)} .d-top{display:flex;flex-wrap:wrap;gap:1rem 1.4rem;align-items:flex-end;justify-content:space-between;margin-bottom:1.2rem} .d-title{font-size:1.1rem;font-weight:600} .d-sub{color:var(--muted);font-size:.95rem} .sm-ctl{display:flex;flex-wrap:wrap;gap:.6rem} .sm-freeze{min-height:46px;min-width:96px;padding:0 1.1rem;border-radius:999px;border:1px solid var(--line);background:none;color:var(--ink);font-weight:600;cursor:pointer;transition:background-color .2s,border-color .2s} .sm-freeze:hover{border-color:var(--accent);background:rgba(249,115,22,.12)} .sm-freeze[aria-pressed=true]{background:var(--accent);color:var(--on-accent);border-color:var(--accent)} .sm-read{display:flex;flex-wrap:wrap;gap:.4rem 1.6rem;margin-bottom:.9rem;color:var(--muted)} .sm-read b{font-family:'IBM Plex Mono',monospace;font-weight:500;color:var(--ink);font-size:1rem} .sm-live{display:inline-flex;align-items:center;gap:.45rem;color:var(--em);font-weight:600} .sm-live i{width:9px;height:9px;border-radius:50%;background:var(--accent);box-shadow:0 0 0 0 rgba(249,115,22,.6);animation:smlive 1.6s ease-out infinite} .frozen .sm-live i{animation:none;background:var(--muted)} .frozen .sm-live{color:var(--muted)} @keyframes smlive{to{box-shadow:0 0 0 8px rgba(249,115,22,0)}} .plot{position:relative;height:340px;border-radius:10px;background:#0A110F} .plot canvas{position:absolute;inset:0;width:100%;height:100%} .d-hint{font-size:.95rem;color:var(--muted);margin-top:.9rem;max-width:72ch} .d-hint strong{color:var(--ink);font-weight:500} .sm-key{display:flex;flex-wrap:wrap;gap:.3rem 1.1rem;font-size:.95rem;color:var(--muted);margin-top:.7rem} .sm-key span{display:inline-flex;align-items:center;gap:.45rem} .sm-key i{width:12px;height:12px;border-radius:2px;background:var(--c)} .d-table{margin-top:.6rem} .d-table summary{display:inline-flex;align-items:center;min-height:44px;cursor:pointer;font-weight:600;color:var(--em)} .dt-wrap{overflow-x:auto} table.dt{width:100%;border-collapse:collapse;font-size:.95rem;font-variant-numeric:tabular-nums} table.dt th,table.dt td{padding:.5rem .6rem;border-bottom:1px solid var(--line);text-align:right;white-space:nowrap} table.dt thead th{color:var(--muted);font-weight:600} table.dt th:first-child,table.dt td:first-child{text-align:left} @media (max-width:760px){.plot{height:260px}} @media (prefers-reduced-motion:reduce){*,*::before,*::after{animation:none!important;transition-duration:.01ms!important}} EOF cat > script.js <<'EOF' // Spindlewatch: live vibration spectrum, 48 log-spaced bands 10 Hz to 10 kHz, -80 to 0 dB. // Input is SIMULATED here. In production, write the sensor's band levels (dB) into lv[] each frame. const reduceMotion = window.matchMedia('(prefers-reduced-motion: reduce)'); const card = document.querySelector('.sm'), cv = card.querySelector('canvas'); const N = 48, FMIN = 10, FMAX = 10000, DBMIN = -80, WARN = -20, ALARM = -10, RPM = 12000, F1 = RPM / 60; const DECADES = Math.log10(FMAX / FMIN); const freqs = Array.from({ length: N }, (_, i) => FMIN * Math.pow(FMAX / FMIN, i / (N - 1))); // simulated peaks: [log10 centre Hz, height dB, width]: 1x and 2x spindle frequency, plus a high-frequency hump const SHAPES = [[Math.log10(F1), 50, 0.012], [Math.log10(F1 * 2), 36, 0.012], [Math.log10(F1 * 3), 22, 0.012], [3.4, 20, 0.08]]; let frozen = false, t = 0, lv = new Array(N).fill(DBMIN), pk = new Array(N).fill(DBMIN), ctx, W, H; const css = getComputedStyle(document.documentElement), v = (n) => css.getPropertyValue(n).trim(); const C = { line: v('--line'), muted: v('--muted'), ink: v('--ink'), good: v('--good'), warn: v('--warn'), bad: v('--bad'), brand: v('--brand') }; const statusOf = (db) => db > ALARM ? 'Alarm' : db > WARN ? 'Warning' : 'Normal'; const colourOf = (db) => db > ALARM ? C.bad : db > WARN ? C.warn : C.good; function fit() { const r = cv.getBoundingClientRect(), d = Math.min(window.devicePixelRatio || 1, 2); cv.width = Math.round(r.width * d); cv.height = Math.round(r.height * d); ctx = cv.getContext('2d'); ctx.setTransform(d, 0, 0, d, 0, 0); W = r.width; H = r.height; } function base(i) { const lf = Math.log10(freqs[i]); let s = -66; SHAPES.forEach((p) => { s += p[1] * Math.exp(-Math.pow(lf - p[0], 2) / (2 * p[2])); }); return Math.min(0, s); } function step(dt, live) { t += dt / 1000; const env = 0.9 + 0.1 * Math.sin(t * 3.1); for (let i = 0; i < N; i++) { const b = base(i); lv[i] = live ? Math.max(DBMIN, Math.min(0, DBMIN + (b - DBMIN) * env + Math.sin(t * 9 + i * 0.7) * 1.2 + (Math.random() - 0.5) * 3)) : b; pk[i] = Math.max(lv[i], pk[i] - dt * 0.02); } } const fl = (f) => f >= 1000 ? f / 1000 + 'k' : String(f); function draw() { const L = 40, R = 8, T = 12, B = 26, pw = W - L - R, ph = H - T - B, Y = (db) => T + (-db / -DBMIN) * ph, X = (f) => L + (Math.log10(f / FMIN) / DECADES) * pw; ctx.clearRect(0, 0, W, H); ctx.font = '12.5px "IBM Plex Sans", sans-serif'; ctx.textBaseline = 'middle'; for (let db = 0; db >= DBMIN; db -= 20) { const y = Y(db); ctx.strokeStyle = C.line; ctx.globalAlpha = 0.4; ctx.beginPath(); ctx.moveTo(L, y); ctx.lineTo(W - R, y); ctx.stroke(); ctx.globalAlpha = 1; ctx.fillStyle = C.muted; ctx.textAlign = 'right'; ctx.fillText(String(db), L - 8, y); } ctx.textAlign = 'center'; (W < 520 ? [10, 100, 1000, 10000] : [10, 20, 50, 100, 200, 500, 1000, 2000, 5000, 10000]).forEach((f) => { ctx.fillStyle = C.muted; ctx.fillText(fl(f), Math.max(L + 6, Math.min(W - R - 8, X(f))), H - B / 2 + 2); }); const bw = pw / N; for (let i = 0; i < N; i++) { const x = L + i * bw + 1, h = ((lv[i] - DBMIN) / -DBMIN) * ph, y = T + ph - h; ctx.fillStyle = colourOf(lv[i]); ctx.fillRect(x, y, Math.max(1, bw - 2), h); ctx.fillStyle = C.ink; ctx.globalAlpha = 0.8; ctx.fillRect(x, T + ph - ((pk[i] - DBMIN) / -DBMIN) * ph - 1, Math.max(1, bw - 2), 2); ctx.globalAlpha = 1; } // threshold lines (labelled so meaning does not rest on colour alone) ctx.setLineDash([5, 4]); ctx.textAlign = 'right'; [[WARN, C.warn, 'Warn -20'], [ALARM, C.bad, 'Alarm -10']].forEach((q) => { const y = Y(q[0]); ctx.strokeStyle = q[1]; ctx.beginPath(); ctx.moveTo(L, y); ctx.lineTo(W - R, y); ctx.stroke(); ctx.fillStyle = q[1]; ctx.fillText(q[2], W - R - 4, y - 8); }); // spindle frequency marker const xs = X(F1); ctx.strokeStyle = C.brand; ctx.beginPath(); ctx.moveTo(xs, T); ctx.lineTo(xs, T + ph); ctx.stroke(); ctx.setLineDash([]); ctx.fillStyle = C.brand; ctx.textAlign = xs > W - 90 ? 'right' : 'left'; ctx.fillText(W < 520 ? '1×' : '1× spindle · 200 Hz', xs + (xs > W - 90 ? -5 : 5), T + ph + 0 - ph + 10 + 36); } const peakEl = card.querySelector('[data-peak]'), levelEl = card.querySelector('[data-level]'), statEl = card.querySelector('[data-status]'), rows = card.querySelector('[data-rows]'), stateEl = card.querySelector('[data-state]'); const fmtF = (f) => f >= 1000 ? (f / 1000).toFixed(f >= 10000 ? 0 : 1) + ' kHz' : Math.round(f) + ' Hz'; const BANDS = [10, 25, 50, 100, 200, 400, 600, 1000, 2000, 5000, 10000]; function readout() { let m = 0; for (let i = 1; i < N; i++) if (lv[i] > lv[m]) m = i; peakEl.textContent = fmtF(freqs[m]); levelEl.textContent = Math.round(lv[m]) + ' dB'; statEl.textContent = statusOf(lv[m]); statEl.style.color = colourOf(lv[m]); rows.innerHTML = BANDS.map((f) => { let k = 0; for (let i = 1; i < N; i++) if (Math.abs(Math.log(freqs[i] / f)) < Math.abs(Math.log(freqs[k] / f))) k = i; return '<tr><th scope="row">' + fmtF(freqs[k]) + '</th><td>' + Math.round(lv[k]) + ' dB</td><td>' + statusOf(lv[k]) + '</td></tr>'; }).join(''); } let raf = 0, last = 0, seen = true, since = 0; const ok = () => !reduceMotion.matches && !frozen && seen && !document.hidden; function tick(now) { raf = 0; const dt = last ? Math.min(now - last, 50) : 16; last = now; if (dt >= 33) { step(dt, true); draw(); since += dt; if (since > 300) { since = 0; readout(); } last = now; } go(); } function go() { if (ok()) { if (!raf) raf = requestAnimationFrame(tick); } else { if (raf) cancelAnimationFrame(raf); raf = 0; last = 0; } } fit(); step(16, false); draw(); readout(); if ('IntersectionObserver' in window) new IntersectionObserver((en) => { seen = en[0].isIntersecting; go(); }).observe(card); document.addEventListener('visibilitychange', go); const fz = card.querySelector('[data-freeze]'); if (reduceMotion.matches) { fz.hidden = true; card.classList.add('frozen'); stateEl.textContent = 'Still frame'; } fz.addEventListener('click', () => { frozen = !frozen; fz.setAttribute('aria-pressed', String(frozen)); card.classList.toggle('frozen', frozen); stateEl.textContent = frozen ? 'Frozen' : 'Live'; if (frozen) readout(); go(); }); addEventListener('resize', () => { fit(); draw(); }); go(); EOF grep -n "T + ph + 0" script.js
  6. ./index.html
  7. ./style.css
  8. ./script.js
  9. W=.; cd $W && node .claude/skills/live-signal-chart/scripts/check.mjs $W/index.html --out $W/check 2>&1 | tail -40
  10. cd . && node .claude/skills/live-signal-chart/scripts/check.mjs index.html --out check 2>&1 | tail -40
  11. ./check/1440.png
  12. ./check/390.png
  13. ./script.js
  14. node .claude/skills/live-signal-chart/scripts/check.mjs index.html --out check 2>&1 | tail -5
  15. ./check/768.png
  16. Done

10 Nov 2026 · Claude Code 2.1.322 with Claude Sonnet 5.5 · 2 min 3 s · $0.37 of API use

Questions

Is Live Signal Chart free?

No. Live Signal Chart costs $9.99 once and stays in your Recaply account, or it comes with the Recaply plan ($19.99 a month), which opens every premium skill and prompt.

Which agents can use Live Signal Chart?

Claude Code, Codex, Cursor, Gemini CLI, GitHub Copilot and OpenCode.

What do I get when I buy Live Signal Chart?

A ZIP of the whole skill folder (35 KB): the SKILL.md your agent follows and its 6 other files, the references, templates and scripts it uses. You download it from this page whenever you need it, and install it in Claude Code, Codex, Cursor, Gemini CLI, GitHub Copilot and OpenCode. The Recaply plan opens it too, with every other premium skill and prompt.

How do I install Live Signal Chart?

Buy it, then download the ZIP from this page. For Claude Code, unzip it into .claude/skills/ in your project. For Codex, Cursor and Gemini CLI, unzip it and run npx skills add ./live-signal-chart with your agent's flag.

What do I get from Live Signal Chart?

One HTML file with its CSS inside: no build step, no framework. A live spectrum analyser chart (levels by frequency). Checked at phone and desktop widths.

What does Live Signal Chart need?

Node 20+ and Chrome, and no API key. Each use costs nothing beyond your agent.

How big is Live Signal Chart?

7 files, about 22,316 tokens in all. The SKILL.md is about 2,280 tokens, and your agent reads it only when the job fits.

What does a run cost?

Our 1 runs took 2 min 3 s to 2 min 3 s and $0.37 to $0.37 of API use each, in Claude Code with claude-sonnet-5-5. On a Claude plan, a run counts toward your usage instead.

Do I have to name Live Signal Chart to use it?

Type /live-signal-chart first to make sure it loads. Without it, Claude Code may judge a small job simple enough to do without the skill.