Skip to content

DirectorySkills

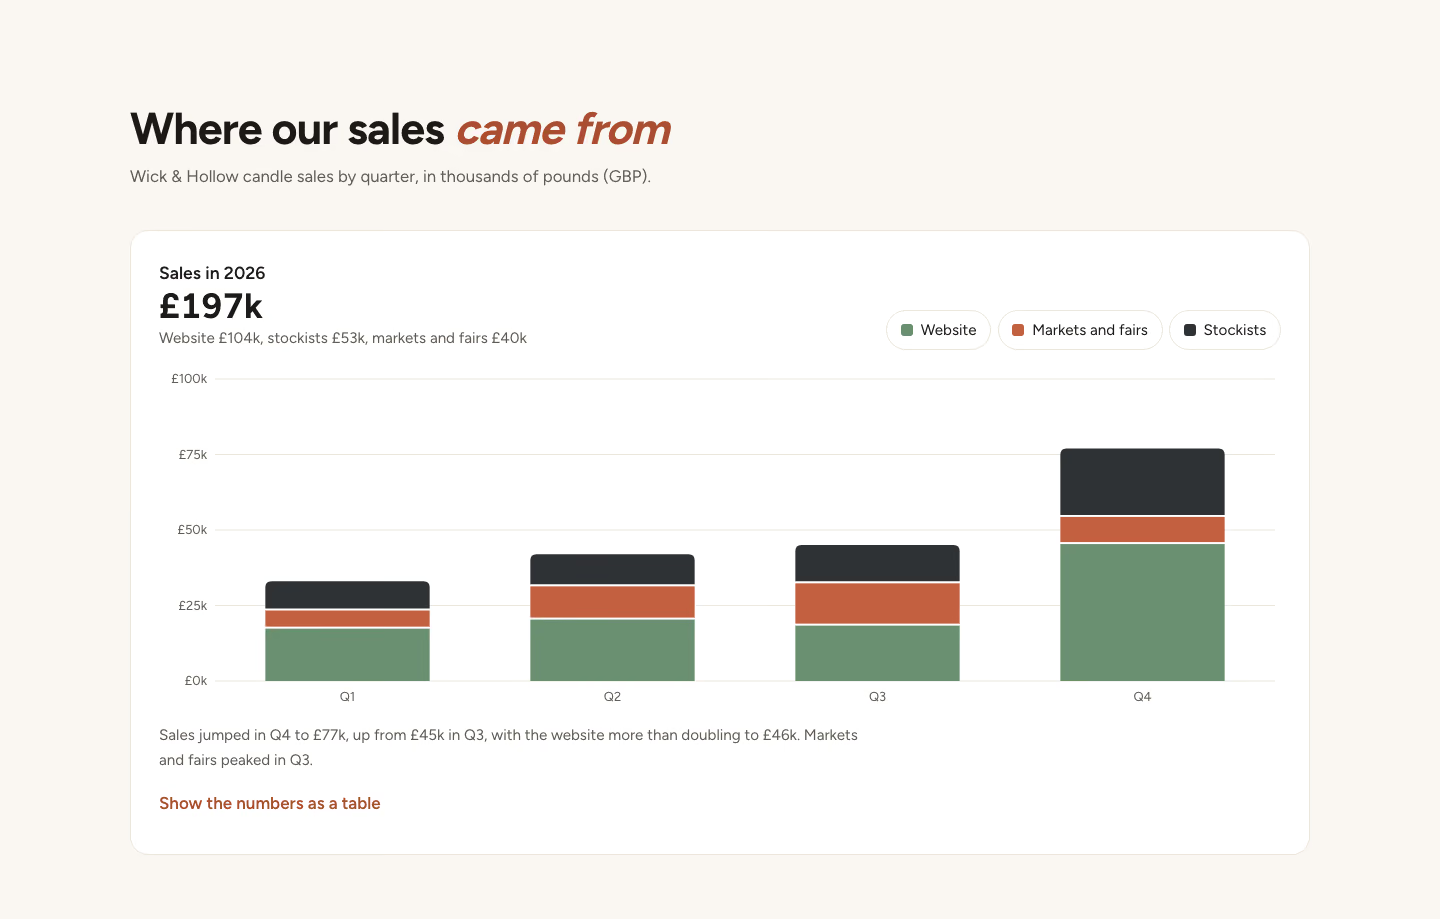
Layered bar chart: 1440, made in this run
Run 1Layered bar chart“Build a stacked bar chart of our sales by channel for each quarter. Numbers in brief.md.”
Runs in
  • Claude Code
  • Codex
  • Cursor
  • Gemini CLI
  • GitHub Copilot
  • OpenCode
Generates with
Your agent's model
Tested with
Claude Code 2.1.322Claude Sonnet 5.51 real run, 10 Nov
Needs
Node 20+Chrome
Licence
Recaply licence

Layered Bar Chart

Monthly stacked columns split into sources, with legend buttons that hide a series and a tooltip for each month.

$9.99once, yours to keep

Builds a stacked column chart with toggleable series into your own project: twelve monthly columns, each stacked from three parts (solar in amber, home battery in green, the grid in indigo); legend buttons above turn each part on and off; hovering or arrowing to a month shows its parts and total. Plain HTML, CSS and JavaScript, or matched to React, Next.js, Vue, Svelte, Astro or Tailwind when the project uses them. Comes with a working reference and a check that screenshots it at phone, tablet and desktop widths and flags sideways overflow, text under 12px, missing alt text and names, low contrast, no focus styles, motion that ignores reduced motion, leftover sample words and emoji icons. Use when someone needs to show how a total splits into parts over time (energy sources, sales channels, costs), or asks for stacked bars or stacked columns.

By RecaplyUpdated 12 Nov

Install Layered Bar Chart

After the download, ask your agent to add it, or run the line yourself.

Read https://recaply.co/skills/layered-bar-chart/install.md and follow it to install the layered-bar-chart skill from layered-bar-chart.zip.

Paste it into your agent. It reads our install steps, finds the ZIP you downloaded and adds the skill for you.

New to skills? How to install a skill

Similar skills

All 735 skills

Who Layered Bar Chart is for

What you get

  • One HTML file with its CSS inside: no build step, no framework
  • A stacked column chart with toggleable series
  • Checked at phone and desktop widths

Good fit

  • When someone needs to show how a total splits into parts over time, or asks for stacked bars or stacked columns

Not for

  • An app with a backend, sign-in or a database
  • Copying another company's site

About this skill

You say

Build a stacked bar chart of our sales by channel for each quarter. Numbers in brief.md.

It said back

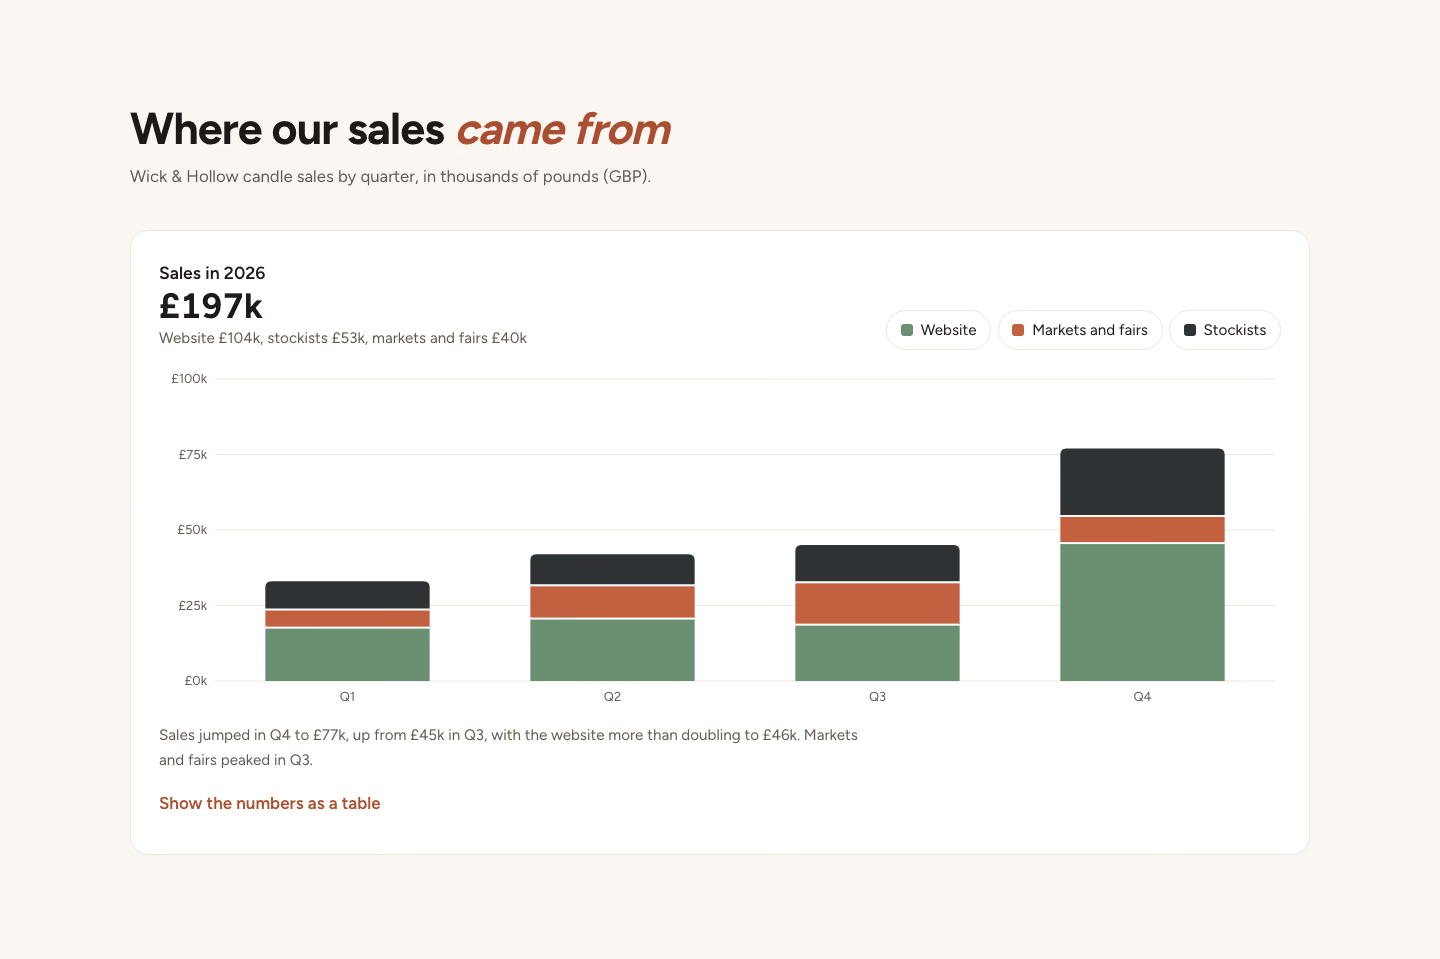
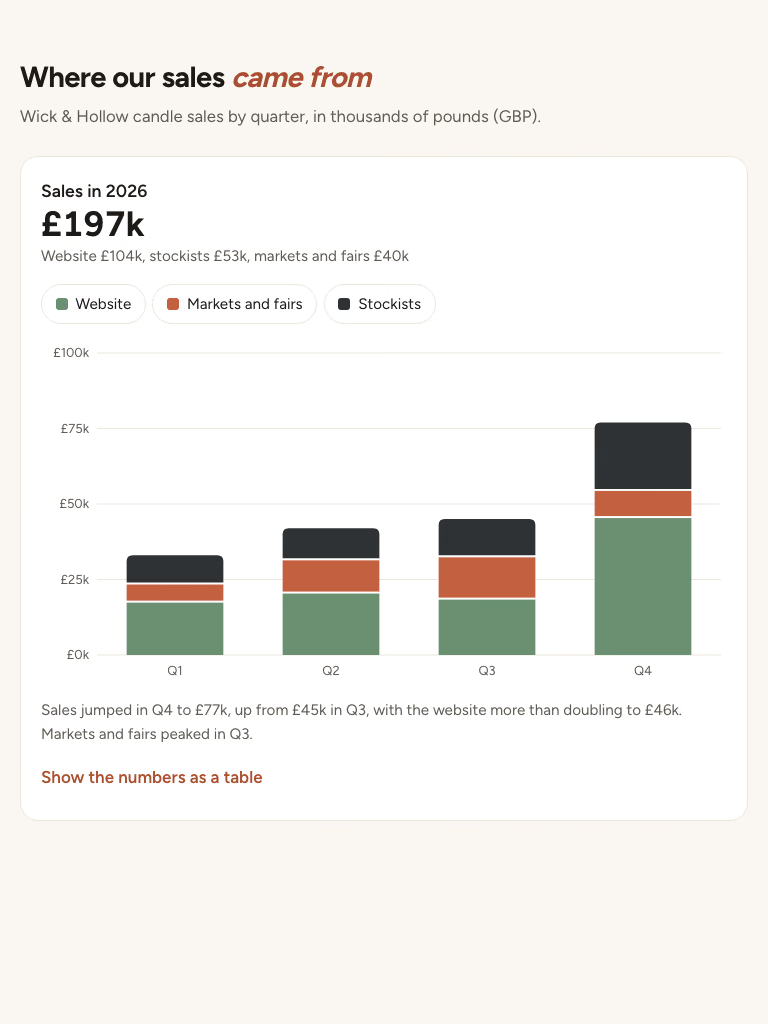
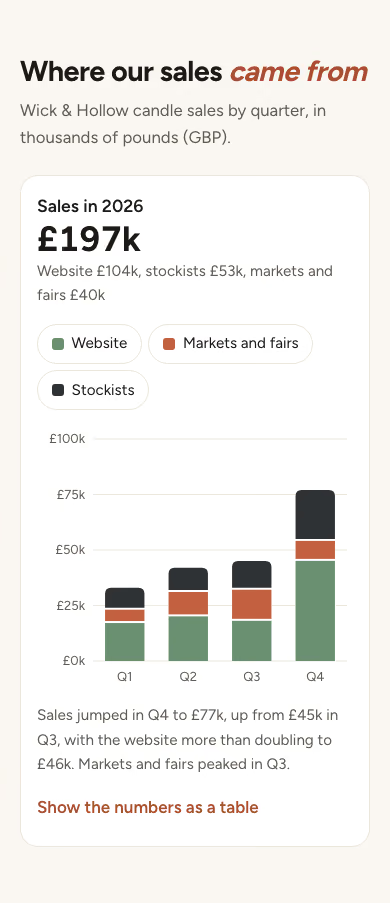
The stacked bar chart is built, with one column per quarter for Q1 to Q4 2026. Each column stacks website in sage, markets and fairs in terracotta, and stockists in charcoal. I used the layered-bar-chart design with those colours and pound labels (£25k, £50k and so on).

The accessibility and layout check passed with no failures. I looked at the 390px and 1440px screenshots and nothing is cut off or crowded. I didn't open the 768px one.

Show more

What it did in run 1

  1. layered-bar-chart
  2. ./brief.md
  3. cd .; ls -a; cd .claude/skills/layered-bar-chart; ls reference; cat reference/index.html reference/style.css reference/script.js
  4. cd .; R=.claude/skills/layered-bar-chart/reference cp $R/style.css style.css sed -i '' -e 's/--accent:#4F46E5/--accent:#2F3234/; s/--em:#4338CA/--em:#A94E30/; s/--solar:#D97706/--web:#6B8F71/; s/--battery:#059669/--markets:#C2603F/; s/--grid:#4F46E5/--stockists:#2F3234/; s/--bg:#FBFAF6/--bg:#FAF7F2/' style.css sed -n '1,/^\/\/ this design/p' $R/script.js | sed '$d' > script.js cat >> script.js <<'EOF' // this design // Stacked columns by quarter; legend toggles hide channels; tooltip and keyboard reading per quarter. const S = JSON.parse(document.getElementById('sc-data').textContent); const KEYS = ['web', 'markets', 'stockists'], NAMES = { web: 'Website', markets: 'Markets and fairs', stockists: 'Stockists' }; const QTR = ['Q1', 'Q2', 'Q3', 'Q4'], N = QTR.length; const on = { web: true, markets: true, stockists: true }; const css = getComputedStyle(document.documentElement); const COL = {}; KEYS.forEach(function (k) { COL[k] = css.getPropertyValue('--' + k).trim(); }); const LINE = css.getPropertyValue('--line').trim(); const pounds = function (v) { return '£' + fmt(v) + 'k'; }; const host = document.querySelector('.sc-plot'); const tip = tooltip(host); let geo = null, at = -1; const tot = function (i) { return KEYS.reduce(function (a, k) { return a + (on[k] ? S[k][i] : 0); }, 0); }; const render = plot(host, function (svg, w, h) { const L = 56, Rm = 6, T = 10, B = 28, pw = w - L - Rm, ph = h - T - B, band = pw / N, bw = band * 0.62; let max = 0; for (let i = 0; i < N; i++) max = Math.max(max, tot(i)); max = max || 1; const ticks = ticksTo(max * 1.05, 4), top = ticks[ticks.length - 1]; const y = function (v) { return T + ph - (v / top) * ph; }; ticks.forEach(function (v) { svgEl('line', { x1: L, x2: w - Rm, y1: y(v), y2: y(v), stroke: LINE }, svg); svgText(svg, L - 8, y(v) + 4, '£' + fmt(v) + 'k', { 'text-anchor': 'end' }); }); const hl = svgEl('rect', { y: T, height: ph, width: band, fill: '#000', 'fill-opacity': 0.04, visibility: 'hidden', rx: 6 }, svg); for (let i = 0; i < N; i++) { const x = L + i * band + (band - bw) / 2; let acc = 0; const vis = KEYS.filter(function (k) { return on[k]; }); vis.forEach(function (k, j) { const v = S[k][i]; const y0 = y(acc), y1 = y(acc + v); acc += v; const topPart = j === vis.length - 1, hgt = Math.max(0, y0 - y1 - (topPart ? 0 : 2)); if (topPart) { const r = Math.min(6, bw / 2, hgt); svgEl('path', { d: 'M' + x + ' ' + y0 + 'V' + (y1 + r) + 'Q' + x + ' ' + y1 + ' ' + (x + r) + ' ' + y1 + 'H' + (x + bw - r) + 'Q' + (x + bw) + ' ' + y1 + ' ' + (x + bw) + ' ' + (y1 + r) + 'V' + y0 + 'Z', fill: COL[k] }, svg); } else svgEl('rect', { x: x, y: y1 + 2, width: bw, height: hgt, fill: COL[k] }, svg); }); svgText(svg, x + bw / 2, h - 8, QTR[i], { 'text-anchor': 'middle' }); } geo = { band: band, L: L, y: y, hl: hl }; if (at >= 0) show(at); }); function show(i) { at = i; if (!geo) return; if (i < 0) { geo.hl.setAttribute('visibility', 'hidden'); tip.hide(); return; } geo.hl.setAttribute('x', geo.L + i * geo.band); geo.hl.setAttribute('visibility', 'visible'); tip.show(geo.L + (i + 0.5) * geo.band, geo.y(tot(i)), '<b>' + QTR[i] + ' 2026</b>' + KEYS.filter(function (k) { return on[k]; }).map(function (k) { return NAMES[k] + ' ' + pounds(S[k][i]); }).join('<br>') + '<br>Total ' + pounds(tot(i))); } host.addEventListener('pointermove', function (e) { const r = host.getBoundingClientRect(); show(Math.max(0, Math.min(N - 1, Math.floor((e.clientX - r.left - geo.L) / geo.band)))); }); host.addEventListener('pointerleave', function () { show(-1); }); reader(host, function () { return N; }, show, function (i) { return QTR[i] + ': ' + KEYS.filter(function (k) { return on[k]; }).map(function (k) { return NAMES[k] + ' ' + S[k][i] + ' thousand pounds'; }).join(', ') + ', total ' + tot(i) + ' thousand pounds'; }); document.querySelectorAll('.lg').forEach(function (b) { b.addEventListener('click', function () { const k = b.dataset.s; const left = KEYS.filter(function (x) { return on[x]; }).length; if (on[k] && left === 1) return; on[k] = !on[k]; b.setAttribute('aria-pressed', String(on[k])); render(); }); }); EOF python3 - <<'EOF' d={'web':[18,21,19,46],'markets':[6,11,14,9],'stockists':[9,10,12,22]} import json names={'web':'Website','markets':'Markets and fairs','stockists':'Stockists'} q=['Q1','Q2','Q3','Q4'] rows=''.join(f'<tr><th scope="row">{q[i]} 2026</th>'+''.join(f'<td>£{d[k][i]}k</td>' for k in d)+f'<td>£{sum(d[k][i] for k in d)}k</td></tr>' for i in range(4)) btn=''.join(f'<button class="lg" type="button" aria-pressed="true" data-s="{k}" style="--c:var(--{k})"><i aria-hidden="true"></i>{names[k]}</button>' for k in d) th=''.join(f'<th scope="col">{names[k]}</th>' for k in d) html=f'''<!doctype html> <html lang="en"> <head> <meta charset="utf-8"> <meta name="viewport" content="width=device-width, initial-scale=1"> <title>Wick &amp; Hollow: sales by channel, 2026</title> <meta name="description" content="Wick &amp; Hollow candle sales in 2026, quarter by quarter, split into website, markets and fairs, and stockists."> <link rel="preconnect" href="https://fonts.googleapis.com"> <link rel="preconnect" href="https://fonts.gstatic.com" crossorigin> <link rel="stylesheet" href="https://fonts.googleapis.com/css2?family=Figtree:wght@400;500;600;700&display=swap"> <link rel="stylesheet" href="style.css"> </head> <body> <a class="skip" href="#main">Skip to content</a> <main id="main"> <section class="d-sec" id="sales" aria-labelledby="sales-h"><div class="sec-head"><h2 id="sales-h">Where our sales <em>came from</em></h2><p class="sub">Wick &amp; Hollow candle sales, quarter by quarter, in thousands of pounds (GBP).</p></div><div class="wrap"><div class="d-card sc"><div class="d-top"><div><p class="d-title">Sales in 2026</p><p class="d-big">£197k</p><p class="d-sub">Website £104k, stockists £53k, markets and fairs £40k</p></div><div class="legend" role="group" aria-label="Show or hide a channel">{btn}</div></div><div class="plot-wrap"><div class="plot sc-plot" tabindex="0" role="group" aria-label="Sales by quarter and channel. Use the left and right arrow keys to read each quarter." aria-describedby="sc-sum"></div><p class="sr-only" aria-live="polite" data-live></p></div><p class="d-hint" id="sc-sum">Sales jumped in Q4 to £77k, up from £45k in Q3, with the website more than doubling to £46k. Markets and fairs peaked in Q3.</p><details class="d-table"><summary>Show the numbers as a table</summary><div class="dt-wrap"><table class="dt"><caption class="sr-only">Sales by quarter and channel, thousands of pounds</caption><thead><tr><th scope="col">Quarter</th>{th}<th scope="col">Total</th></tr></thead><tbody>{rows}</tbody></table></div></details><script type="application/json" id="sc-data">{json.dumps(d)}</script></div></div></section> </main> <script src="script.js" defer></script> </body> </html> ''' open('index.html','w').write(html) EOF node .claude/skills/layered-bar-chart/scripts/check.mjs index.html --out check 2>&1 | tail -30
  5. cd . && cp .claude/skills/layered-bar-chart/reference/style.css style.css && sed -i '' -e 's/--accent:#4F46E5/--accent:#2F3234/; s/--em:#4338CA/--em:#A94E30/; s/--solar:#D97706/--web:#6B8F71/; s/--battery:#059669/--markets:#C2603F/; s/--grid:#4F46E5/--stockists:#2F3234/; s/--bg:#FBFAF6/--bg:#FAF7F2/' style.css && grep -c web style.css && sed -n '1,/^\/\/ this design/p' .claude/skills/layered-bar-chart/reference/script.js | sed '$d' > script.js && wc -l script.js
  6. ./style.css
  7. ./index.html
  8. ./script.js
  9. node .claude/skills/layered-bar-chart/scripts/check.mjs ./index.html --out ./check 2>&1 | tail -30
  10. W=.; node $W/.claude/skills/layered-bar-chart/scripts/check.mjs $W/index.html --out $W/check 2>&1 | tail -30
  11. node ./.claude/skills/layered-bar-chart/scripts/check.mjs ./index.html --out ./check 2>&1 | tail -30
  12. ./check/1440.png
  13. ./check/390.png
  14. Done

10 Nov 2026 · Claude Code 2.1.322 with Claude Sonnet 5.5 · 1 min 28 s · $0.30 of API use

Questions

Is Layered Bar Chart free?

No. Layered Bar Chart costs $9.99 once and stays in your Recaply account, or it comes with the Recaply plan ($19.99 a month), which opens every premium skill and prompt.

Which agents can use Layered Bar Chart?

Claude Code, Codex, Cursor, Gemini CLI, GitHub Copilot and OpenCode.

What do I get when I buy Layered Bar Chart?

A ZIP of the whole skill folder (34 KB): the SKILL.md your agent follows and its 6 other files, the references, templates and scripts it uses. You download it from this page whenever you need it, and install it in Claude Code, Codex, Cursor, Gemini CLI, GitHub Copilot and OpenCode. The Recaply plan opens it too, with every other premium skill and prompt.

How do I install Layered Bar Chart?

Buy it, then download the ZIP from this page. For Claude Code, unzip it into .claude/skills/ in your project. For Codex, Cursor and Gemini CLI, unzip it and run npx skills add ./layered-bar-chart with your agent's flag.

What do I get from Layered Bar Chart?

One HTML file with its CSS inside: no build step, no framework. A stacked column chart with toggleable series. Checked at phone and desktop widths.

What does Layered Bar Chart need?

Node 20+ and Chrome, and no API key. Each use costs nothing beyond your agent.

How big is Layered Bar Chart?

7 files, about 21,917 tokens in all. The SKILL.md is about 2,153 tokens, and your agent reads it only when the job fits.

What does a run cost?

Our 1 runs took 1 min 28 s to 1 min 28 s and $0.30 to $0.30 of API use each, in Claude Code with claude-sonnet-5-5. On a Claude plan, a run counts toward your usage instead.

Do I have to name Layered Bar Chart to use it?

Type /layered-bar-chart first to make sure it loads. Without it, Claude Code may judge a small job simple enough to do without the skill.