 Video
Research Report Hero


 Editorial hero for a report
 Claude CodeCodexCursor
 Gemini CLI
 GitHub Copilot
 OpenCode
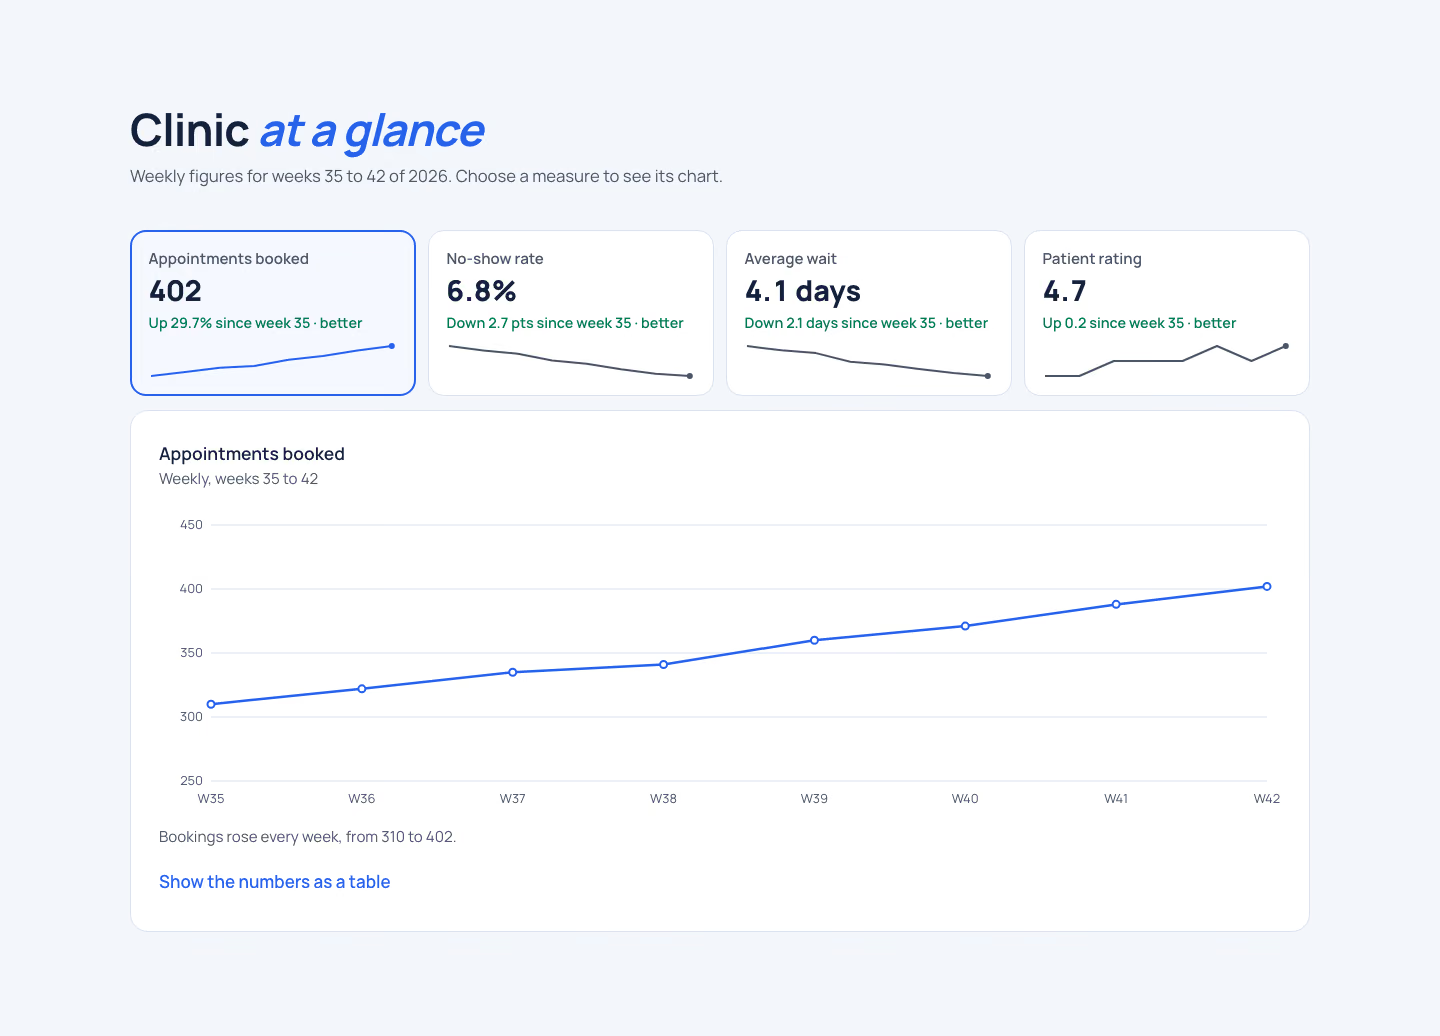
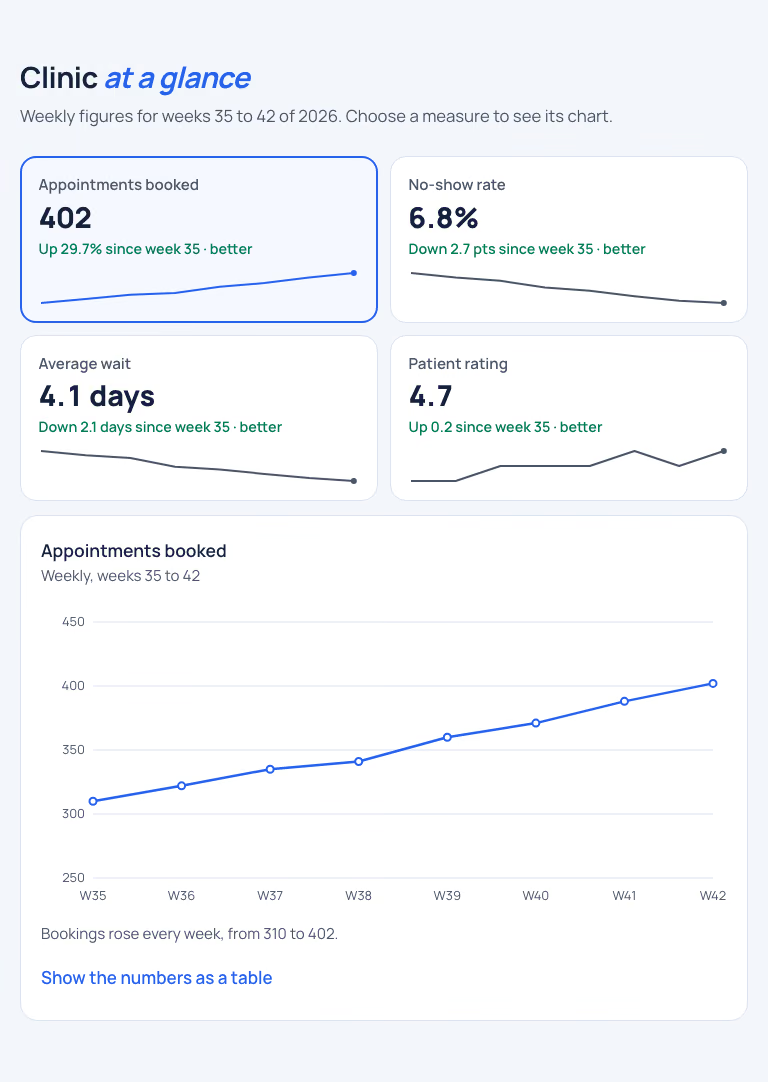
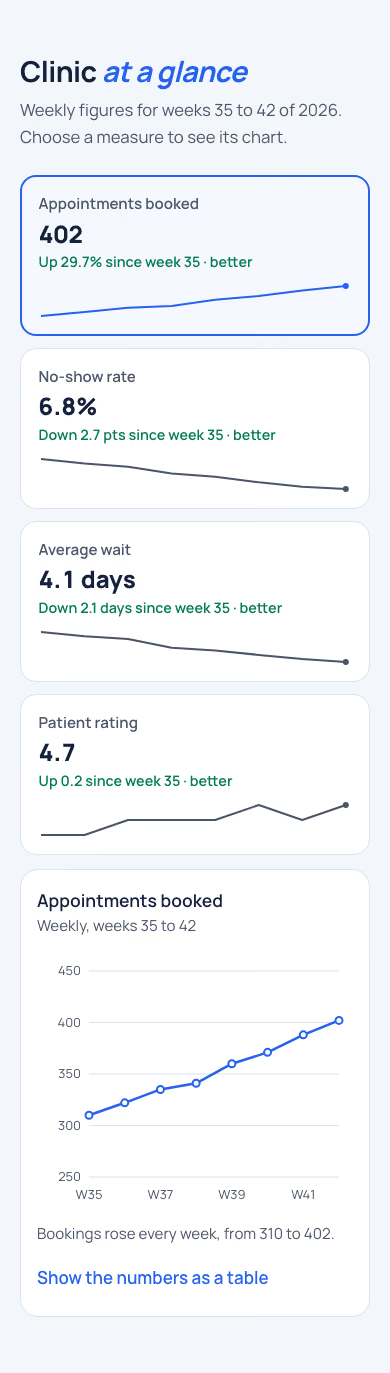
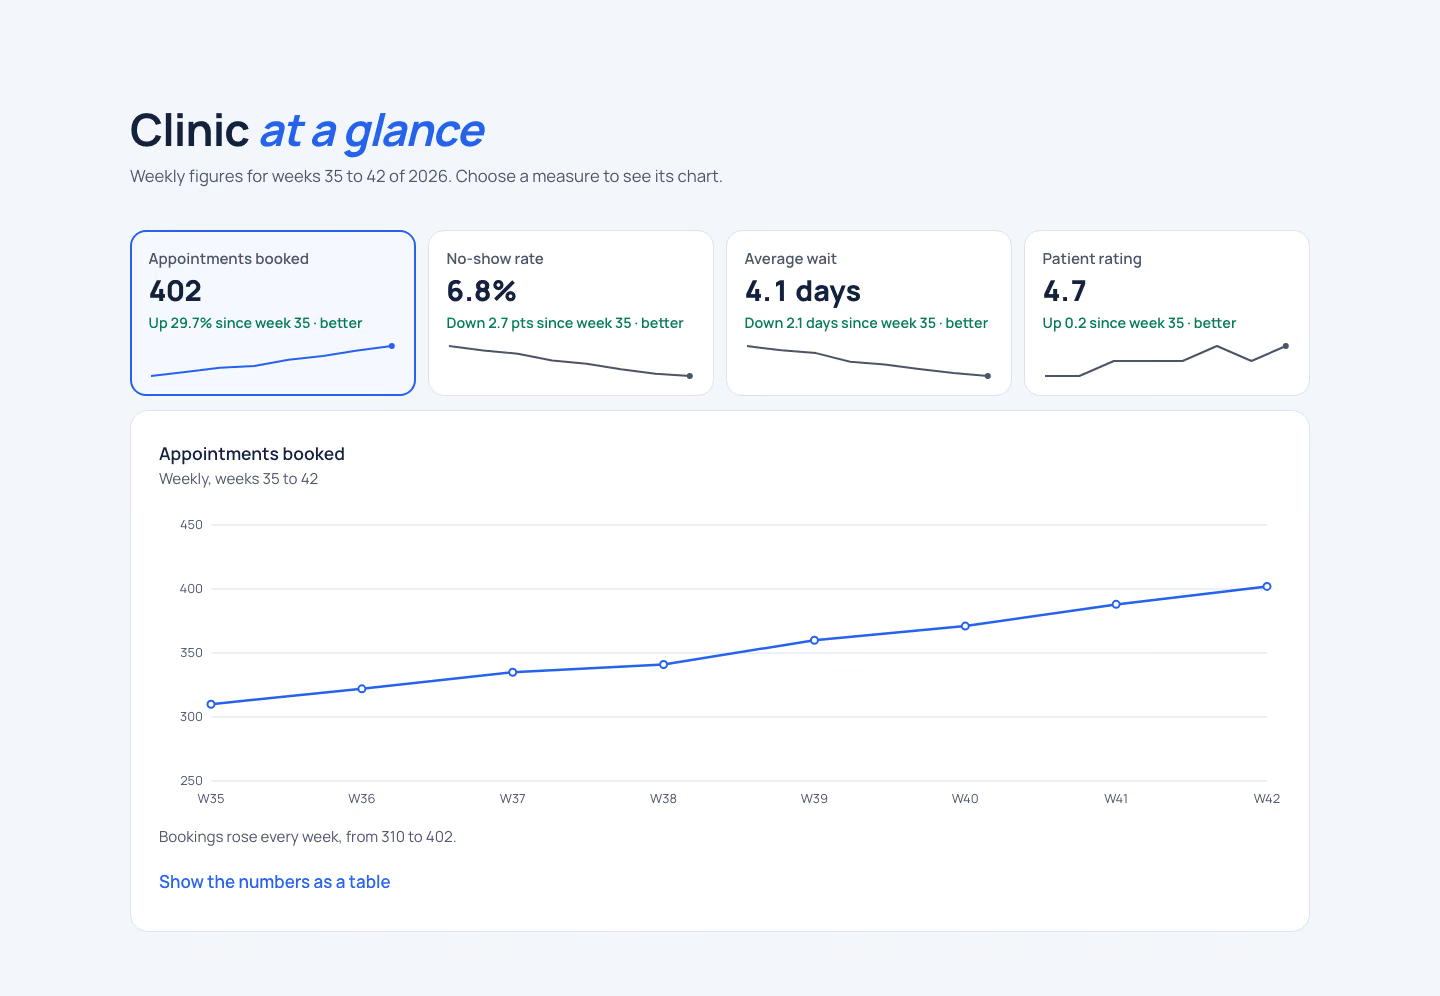
Four KPI tabs, each with its figure, change and a sparkline; the chosen KPI opens as a full line chart underneath.
$9.99once, yours to keep
Payments are non-refundable. See our Terms of service.
Yours. Download it, then add it to your agent.
Builds a panel of KPI cards with sparklines that drive a larger line chart into your own project: a row of four KPI cards (active users, new sign-ups, churn, average session), each showing the figure, a coloured change with words and a small sparkline; the chosen card is outlined in violet and its 12-week line chart fills the panel below with points and a tooltip. Plain HTML, CSS and JavaScript, or matched to React, Next.js, Vue, Svelte, Astro or Tailwind when the project uses them. Comes with a working reference and a check that screenshots it at phone, tablet and desktop widths and flags sideways overflow, text under 12px, missing alt text and names, low contrast, no focus styles, motion that ignores reduced motion, leftover sample words and emoji icons. Use when a dashboard needs several headline measures at once with a way to look closer at one, or someone asks for KPI cards, sparklines or metric tiles with a chart.
By RecaplyUpdated 12 Nov
Video
Editorial hero for a report
 Video1 view, 0 downloads
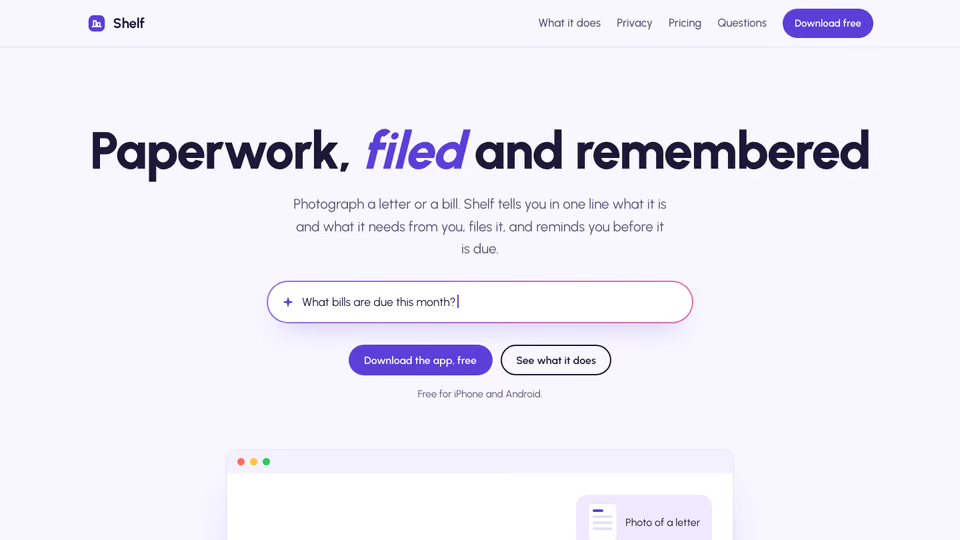
Lavender page for an AI app
 Video
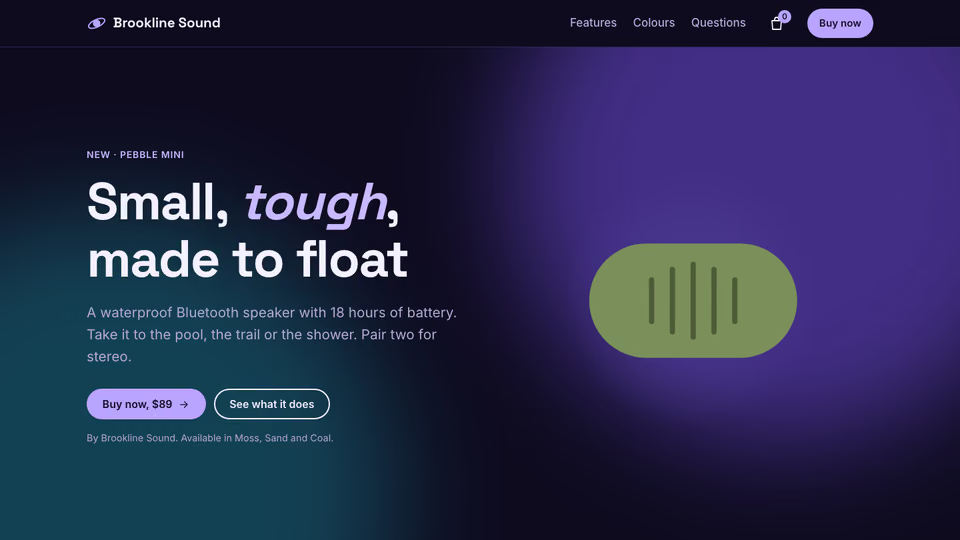
Product page for headphones
 Video
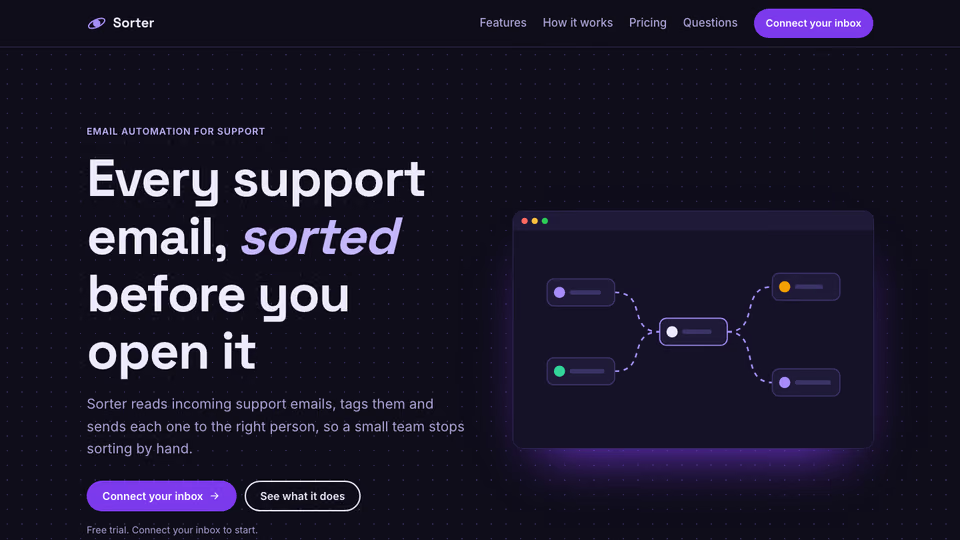
Page with a node-flow hero
You say
Make a row of KPI cards with little trend lines for our clinic dashboard; clicking one should open its chart. Data in brief.md.
It said back
I've built the row of four KPI cards with trend lines. Clicking a card opens its 8-week line chart underneath. Every check passed (no sideways scrolling, text sizes, contrast, focus styles, reduced motion, no script errors). I looked at the 390px and 1440px screenshots and both read cleanly. I didn't open the 768px one. I haven't tried clicking the cards or using the keyboard in a browser.
What's on the page
What it did in run 1
No. KPI Sparkline Panel costs $9.99 once and stays in your Recaply account, or it comes with the Recaply plan ($19.99 a month), which opens every premium skill and prompt.
Claude Code, Codex, Cursor, Gemini CLI, GitHub Copilot and OpenCode.
A ZIP of the whole skill folder (34 KB): the SKILL.md your agent follows and its 6 other files, the references, templates and scripts it uses. You download it from this page whenever you need it, and install it in Claude Code, Codex, Cursor, Gemini CLI, GitHub Copilot and OpenCode. The Recaply plan opens it too, with every other premium skill and prompt.
Buy it, then download the ZIP from this page. For Claude Code, unzip it into .claude/skills/ in your project. For Codex, Cursor and Gemini CLI, unzip it and run npx skills add ./kpi-sparkline-panel with your agent's flag.
One HTML file with its CSS inside: no build step, no framework. A panel of KPI cards with sparklines that drive a larger line chart. Checked at phone and desktop widths.
Node 20+ and Chrome, and no API key. Each use costs nothing beyond your agent.
7 files, about 22,496 tokens in all. The SKILL.md is about 2,153 tokens, and your agent reads it only when the job fits.
Our 1 runs took 2 min 25 s to 2 min 25 s and $0.43 to $0.43 of API use each, in Claude Code with claude-sonnet-5-5. On a Claude plan, a run counts toward your usage instead.
Type /kpi-sparkline-panel first to make sure it loads. Without it, Claude Code may judge a small job simple enough to do without the skill.