 Video
Research Report Hero


 Editorial hero for a report

 Claude CodeCodexCursor
 Gemini CLI
 GitHub Copilot
 OpenCode
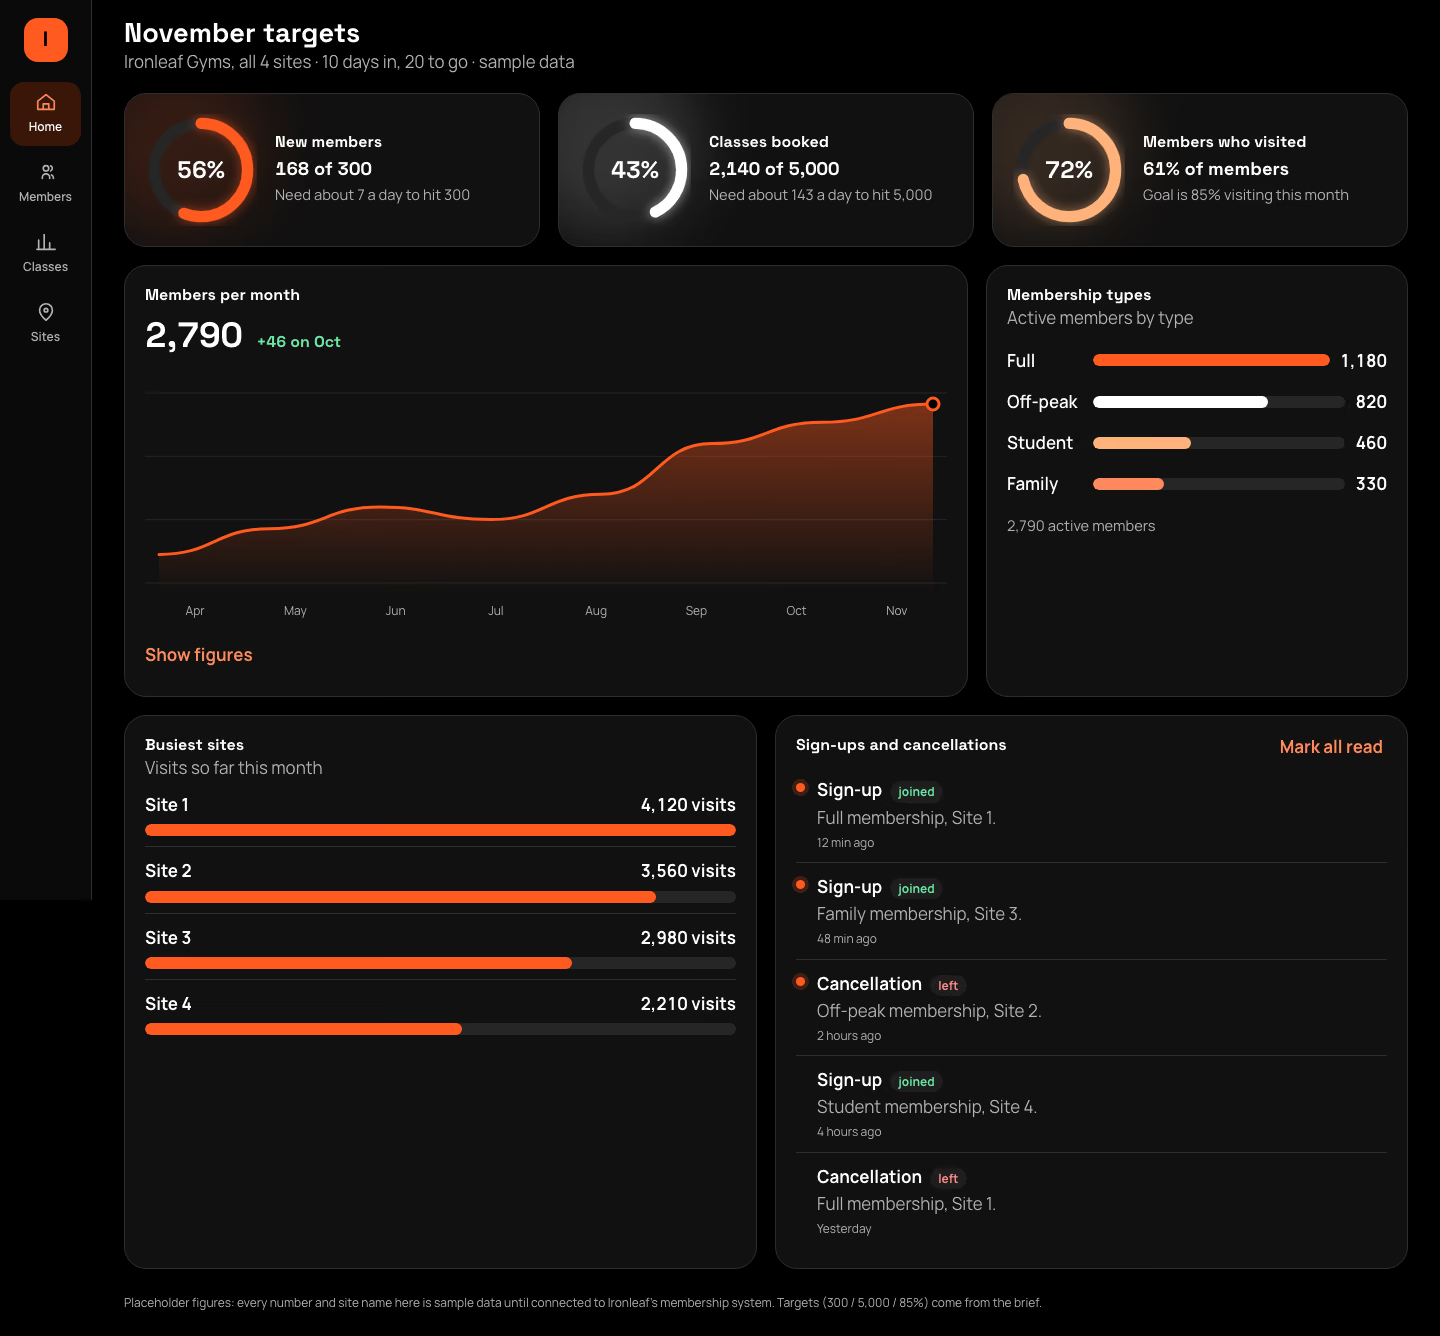
A dark admin dashboard built around goal rings: an icon rail, three ring goals, a revenue area chart, plan mix, accounts and activity.
$9.99once, yours to keep
Payments are non-refundable. See our Terms of service.
Yours. Download it, then add it to your agent.
Builds a dark admin dashboard with goal rings into your own project: deep navy screen with a narrow icon rail; a greeting and a This month / This quarter switch; three cards each with a glowing progress ring (revenue goal, new trials, churn kept under its limit); a smooth revenue area chart with hover readout; plan mix bars; top accounts with plan chips; an activity feed with a Mark all read button. Plain HTML, CSS and JavaScript, or matched to React, Next.js, Vue, Svelte, Astro or Tailwind when the project uses them. Comes with a working reference and a check that screenshots it at phone, tablet and desktop widths and flags sideways overflow, text under 12px, missing alt text and names, low contrast, no focus styles, motion that ignores reduced motion, leftover sample words and emoji icons. Use when a SaaS, subscription, membership or creator business wants a striking dark admin home that shows progress to goals, or someone asks for a dark dashboard, analytics admin, ring or radial progress dashboard.
By RecaplyUpdated 12 Nov
Video
Editorial hero for a report
 Video1 view, 0 downloads
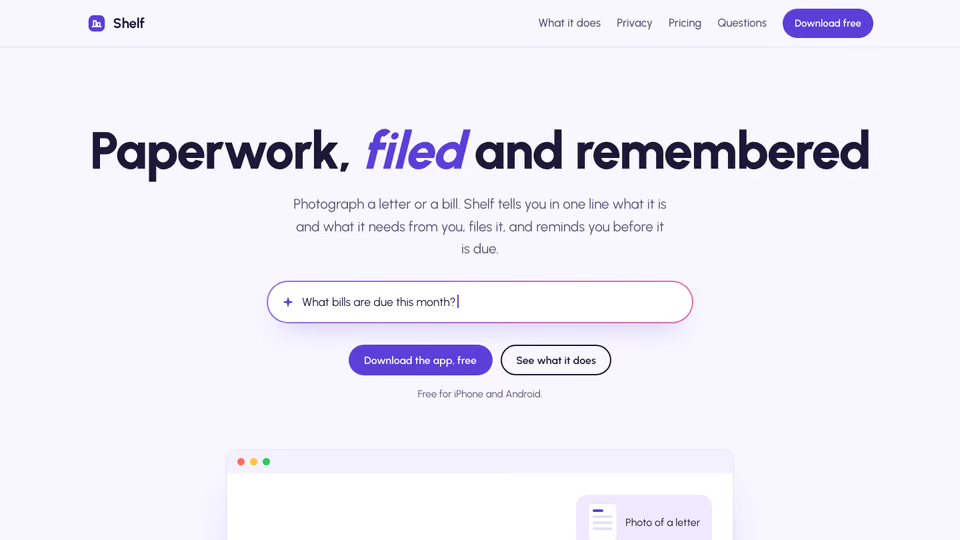
Lavender page for an AI app
 Video
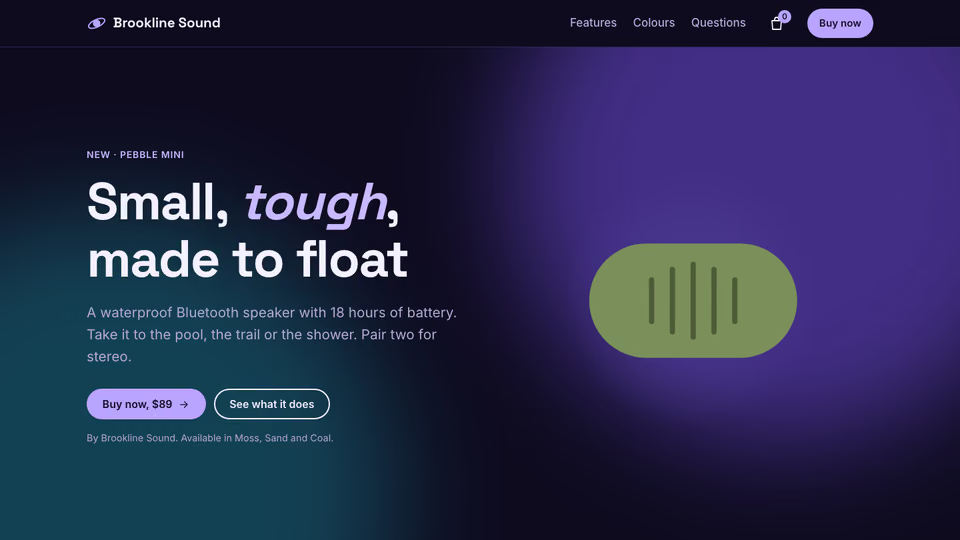
Product page for headphones
 Video
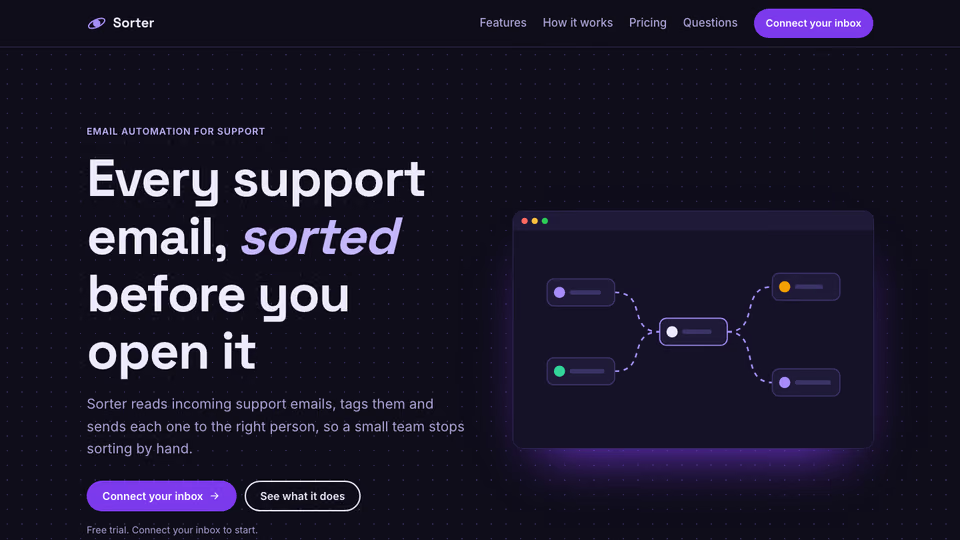
Page with a node-flow hero
You say
Make a dark dashboard for our gym chain's owners showing progress to this month's targets. Details in brief.md.
It said back
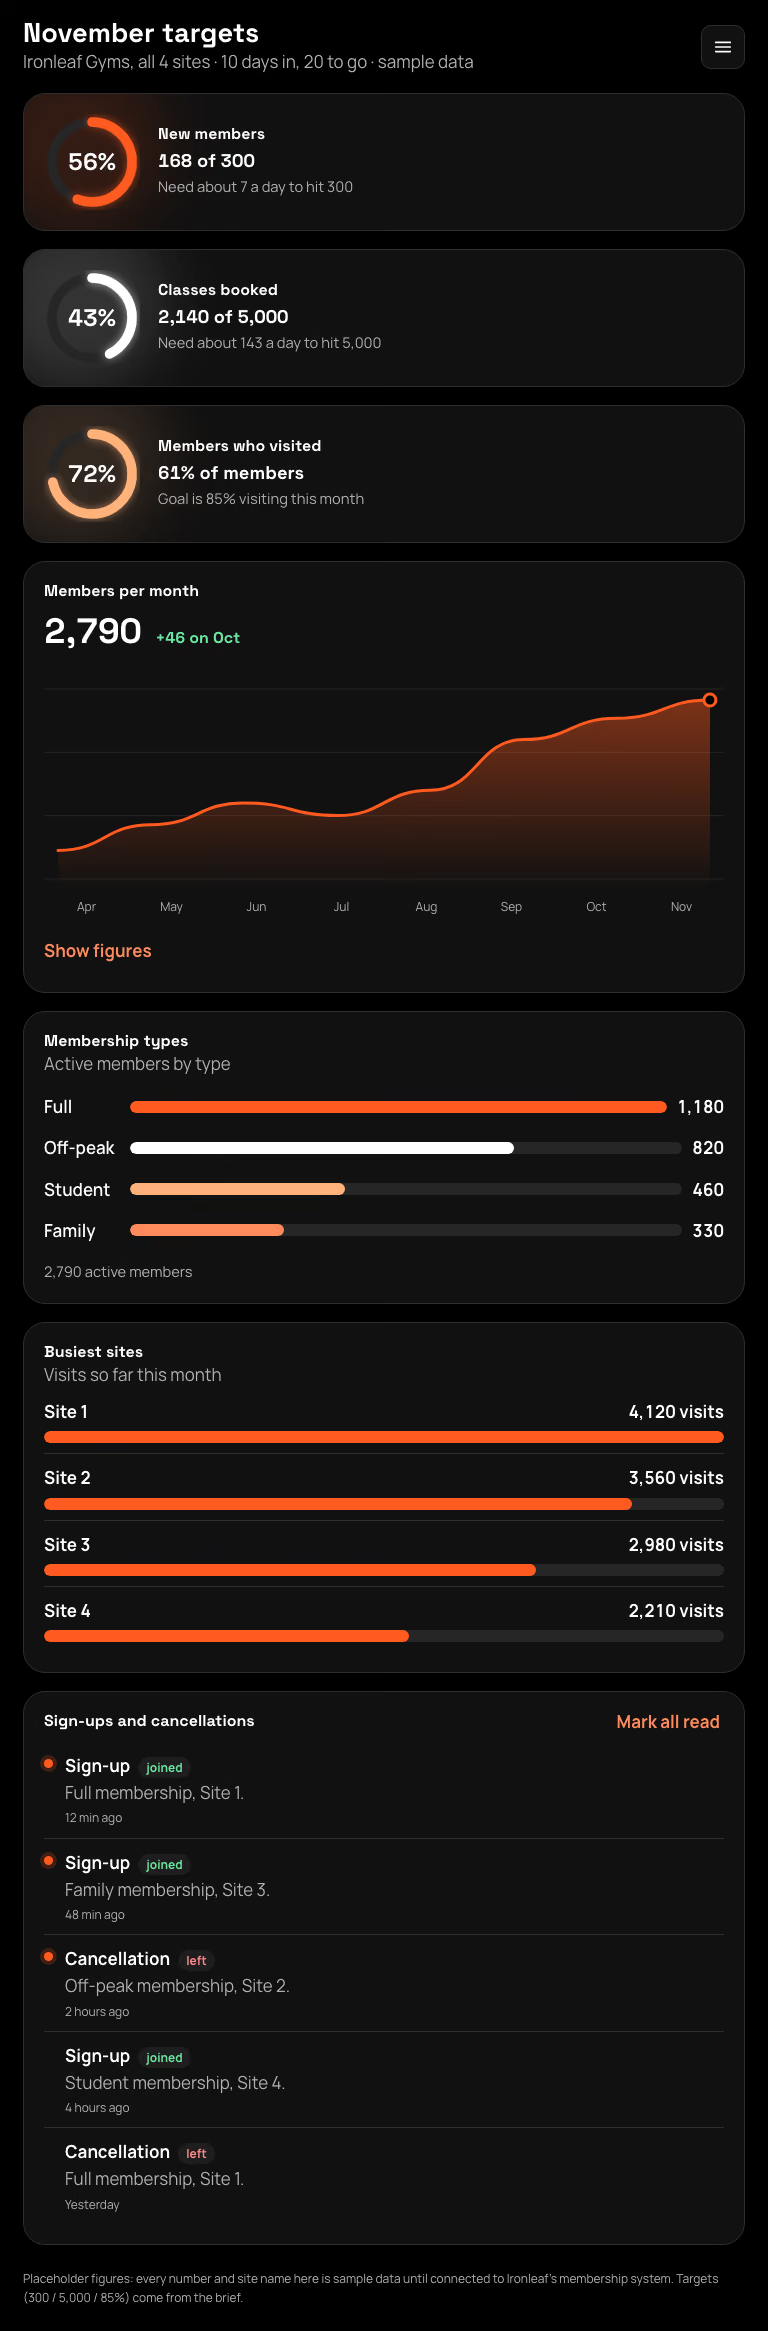
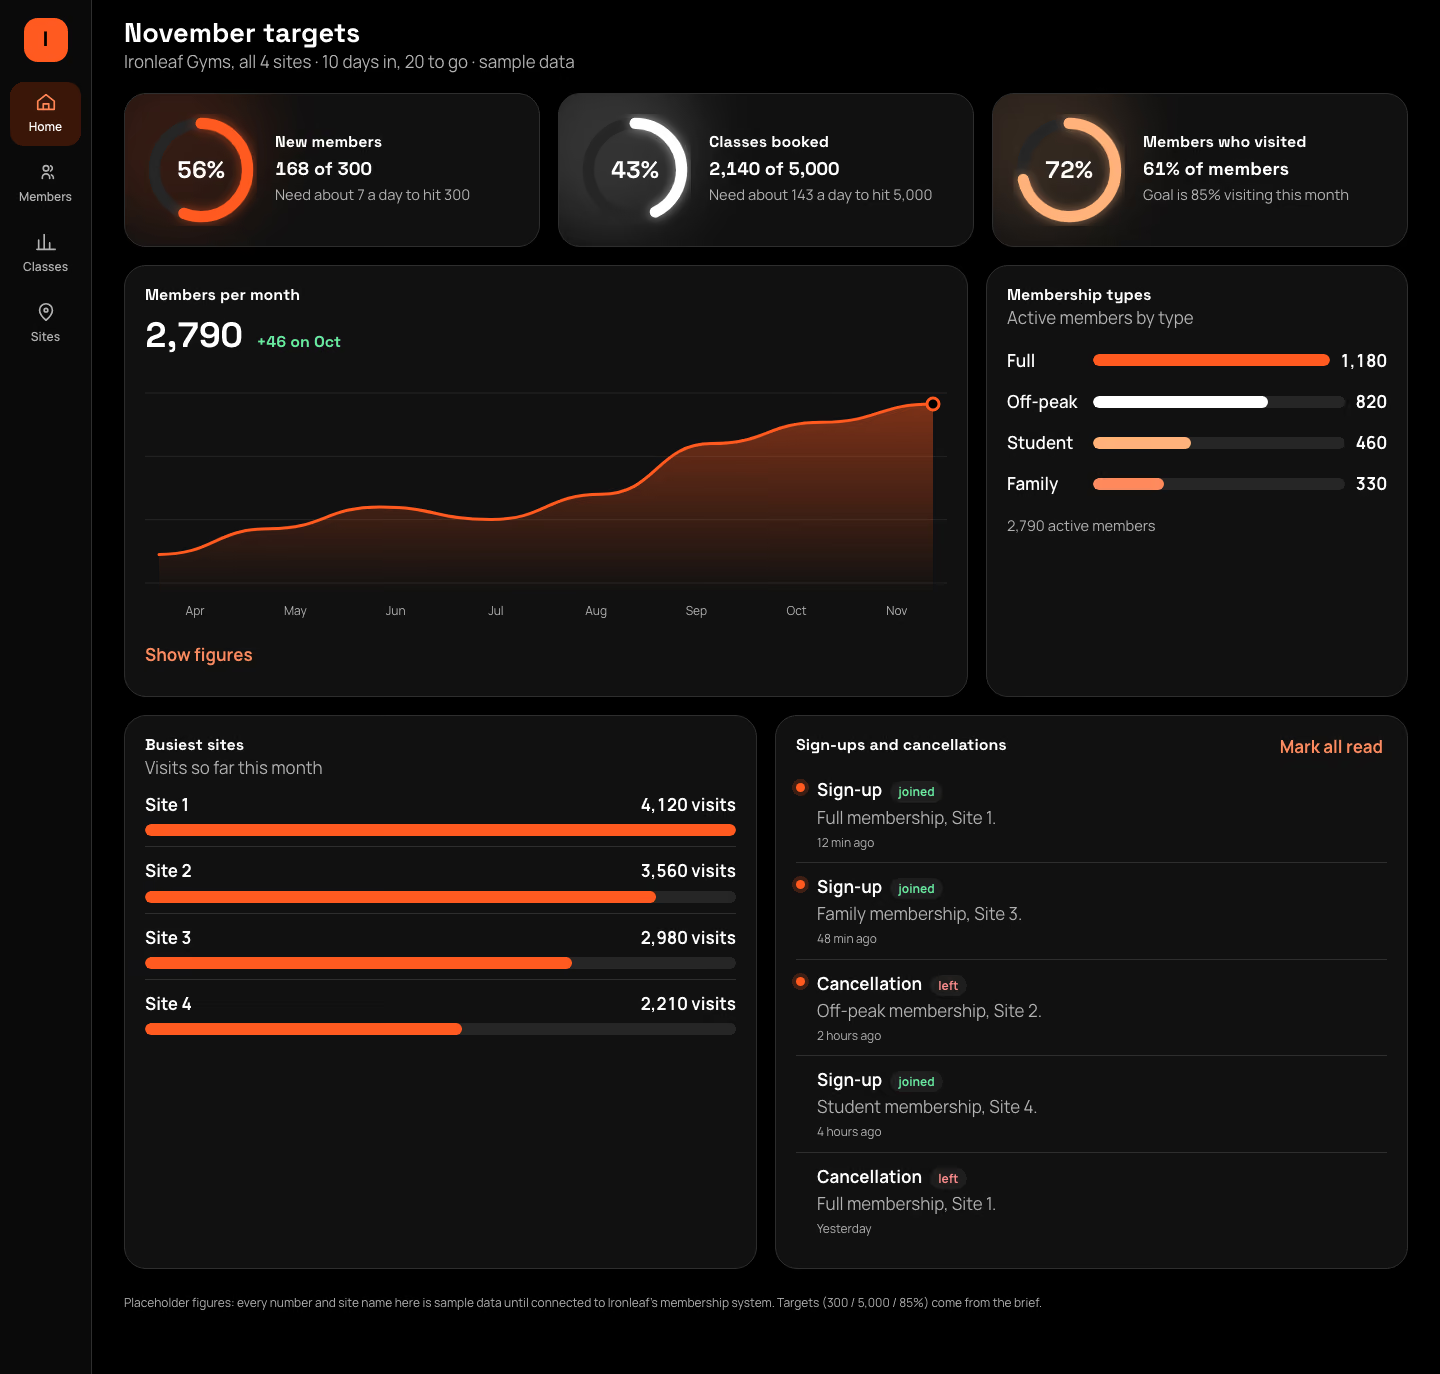
The dashboard is built, but every number on it is sample data. The brief has your targets and layout but no real figures or site names. The automated checks pass at phone, tablet and desktop widths, and I looked at the phone and desktop screenshots. I didn't look at the tablet one.
It's black with electric orange and white accents, with a slim icon rail down the left.
What it did in run 1
<section class="card ring-card" style="--c:${t.color}" aria-labelledby="${t.id}-h"><div class="ring">${ringSvg}<span class="pct num">${Math.round(t.value / t.goal * 100)}%</span></div><div><h2 id="${t.id}-h">${t.name}</h2><p class="rv num">${t.unit ? t.value + '% of members, goal ' + t.goal + '%' : t.fmt(t.value) + ' of ' + t.fmt(t.goal)}</p><p class="rn">${t.note}</p><p class="sr-only">${Math.round(t.value / t.goal * 100)}% of the way to target</p></div></section>).join(''); requestAnimationFrame(() => document.querySelectorAll('.ring-card').forEach((c, i) => { const t = DATA.targets[i]; c.querySelector('.val').style.strokeDasharray = Math.min(100, t.value / t.goal * 100) + ' 100'; })); const tot = DATA.types.reduce((a, t) => a + t[1], 0), max = Math.max(...DATA.types.map((t) => t[1])); $('[data-mix]').innerHTML = DATA.types.map((t) => <li style="--c:${t[2]};--w:${t[1] / max * 100}%"><span class="mn">${t[0]}</span><span class="mb" aria-hidden="true"><i></i></span><span class="mv num">${t[1].toLocaleString('en-GB')}</span></li>).join(''); $('[data-mixtot]').textContent = tot.toLocaleString('en-GB') + ' active members'; const smax = DATA.sites[0][1]; $('[data-sites]').innerHTML = DATA.sites.map((s) => <li><b>${s[0]}</b><span class="mv num">${s[1].toLocaleString('en-GB')} visits</span><span class="mb" aria-hidden="true" style="--c:var(--accent);--w:${s[1] / smax * 100}%"><i></i></span></li>).join(''); $('[data-act]').innerHTML = DATA.activity.map((a) => <li class="${a[4] ? 'un' : ''}"><span class="ud" aria-hidden="true"></span><span><b>${a[1]}<span class="tag ${a[0] === 'in' ? 'pos' : 'neg'}">${a[0] === 'in' ? 'joined' : 'left'}</span></b>${a[2]}<small>${a[3]}${a[4] ? '<span class="sr-only">, unread</span>' : ''}</small></span></li>).join(''); $('[data-read-all]').addEventListener('click', () => { const un = document.querySelectorAll('.act li.un'); un.forEach((li) => { li.classList.remove('un'); li.querySelector('small .sr-only')?.remove(); }); $('[data-act-live]').textContent = un.length ? un.length + ' items marked as read.' : 'Nothing unread.'; }); const area = $('[data-area]'), svg = area.querySelector('svg'), NS = 'http://www.w3.org/2000/svg', readEl = $('[data-read]'), s = DATA.months; let pts = []; function el(t, a) { const e = document.createElementNS(NS, t); for (const k in a) e.setAttribute(k, a[k]); svg.appendChild(e); return e; } function chart(animate) { const w = area.clientWidth, h = area.clientHeight, pad = 14; svg.setAttribute('viewBox', 0 0 ${w} ${h}); svg.replaceChildren(); const vals = s.map((x) => x[1]), lo = Math.min(...vals) * 0.97, hi = Math.max(...vals) * 1.01; const X = (i) => pad + i * (w - pad * 2) / (s.length - 1), Y = (v) => h - 10 - (v - lo) / (hi - lo) * (h - 30); for (let g = 0; g < 4; g++) el('line', { class: 'gl', x1: 0, x2: w, y1: 20 + g * (h - 30) / 3, y2: 20 + g * (h - 30) / 3 }); pts = s.map((x, i) => [X(i), Y(x[1])]); let d = M${pts[0][0]} ${pts[0][1]}; for (let i = 1; i < pts.length; i++) { const p = pts[i - 1], q = pts[i], cx = (p[0] + q[0]) / 2; d += C${cx} ${p[1]} ${cx} ${q[1]} ${q[0]} ${q[1]}; } const defs = el('defs', {}), lg = document.createElementNS(NS, 'linearGradient'); lg.setAttribute('id', 'orbg'); lg.setAttribute('x1', 0); lg.setAttribute('x2', 0); lg.setAttribute('y1', 0); lg.setAttribute('y2', 1); lg.innerHTML = '<stop offset="0" stop-color="#FF5A1F" stop-opacity=".45"/><stop offset="1" stop-color="#FF5A1F" stop-opacity="0"/>'; defs.appendChild(lg); el('path', { d: ${d}L${pts.at(-1)[0]} ${h}L${pts[0][0]} ${h}Z, fill: 'url(#orbg)' }); const ln = el('path', { class: 'ln', d }); if (animate && !reduceMotion.matches) { const L = ln.getTotalLength(); ln.style.strokeDasharray = L; ln.style.strokeDashoffset = L; ln.getBoundingClientRect(); ln.style.transition = 'stroke-dashoffset .8s ease'; ln.style.strokeDashoffset = 0; } el('circle', { class: 'pt', cx: pts.at(-1)[0], cy: pts.at(-1)[1], r: 6 }); $('[data-mons]').innerHTML = s.map((x) => <li>${x[0]}</li>).join(''); $('[data-figs]').innerHTML = s.map((x) => <tr><td>${x[0]}</td><td>${x[1].toLocaleString('en-GB')}</td></tr>).join(''); area.setAttribute('aria-label', Members per month, from ${s[0][1].toLocaleString('en-GB')} in ${s[0][0]} to ${s.at(-1)[1].toLocaleString('en-GB')} in ${s.at(-1)[0]}.); } const delta = s.at(-1)[1] - s.at(-2)[1]; $('[data-mrr]').innerHTML = ${s.at(-1)[1].toLocaleString('en-GB')} <span class="up ${delta < 0 ? 'dn' : ''}">${delta >= 0 ? '+' : ''}${delta} on ${s.at(-2)[0]}</span>; area.addEventListener('pointermove', (e) => { const x = e.clientX - area.getBoundingClientRect().left; let k = 0; pts.forEach((p, i) => { if (Math.abs(p[0] - x) < Math.abs(pts[k][0] - x)) k = i; }); readEl.innerHTML = ${s[k][0]}<b>${s[k][1].toLocaleString('en-GB')}</b>; let c = svg.querySelector('.cur'); if (!c) c = el('line', { class: 'cur', y1: 0 }); c.setAttribute('x1', pts[k][0]); c.setAttribute('x2', pts[k][0]); c.setAttribute('y2', area.clientHeight); }); area.addEventListener('pointerleave', () => { readEl.innerHTML = ''; svg.querySelector('.cur')?.remove(); }); requestAnimationFrame(() => chart(true)); if ('ResizeObserver' in window) { let w0 = 0; new ResizeObserver(() => { if (area.clientWidth !== w0) { w0 = area.clientWidth; chart(false); } }).observe(area); } E node .claude/skills/goal-rings-dashboard/scripts/check.mjs index.html --out check 2>&1 | tail -30No. Goal Rings Dashboard costs $9.99 once and stays in your Recaply account, or it comes with the Recaply plan ($19.99 a month), which opens every premium skill and prompt.
Claude Code, Codex, Cursor, Gemini CLI, GitHub Copilot and OpenCode.
A ZIP of the whole skill folder (36 KB): the SKILL.md your agent follows and its 6 other files, the references, templates and scripts it uses. You download it from this page whenever you need it, and install it in Claude Code, Codex, Cursor, Gemini CLI, GitHub Copilot and OpenCode. The Recaply plan opens it too, with every other premium skill and prompt.
Buy it, then download the ZIP from this page. For Claude Code, unzip it into .claude/skills/ in your project. For Codex, Cursor and Gemini CLI, unzip it and run npx skills add ./goal-rings-dashboard with your agent's flag.
One HTML file with its CSS inside: no build step, no framework. A dark admin dashboard with goal rings. Checked at phone and desktop widths.
Node 20+ and Chrome, and no API key. Each use costs nothing beyond your agent.
7 files, about 24,043 tokens in all. The SKILL.md is about 2,295 tokens, and your agent reads it only when the job fits.
Our 1 runs took 2 min 19 s to 2 min 19 s and $0.45 to $0.45 of API use each, in Claude Code with claude-sonnet-5-5. On a Claude plan, a run counts toward your usage instead.
Type /goal-rings-dashboard first to make sure it loads. Without it, Claude Code may judge a small job simple enough to do without the skill.