 Video1 view, 0 downloads
Explainer Pictures


 One picture that explains how it works
 Claude CodeCodexCursor
 Gemini CLI
 GitHub Copilot
 OpenCode
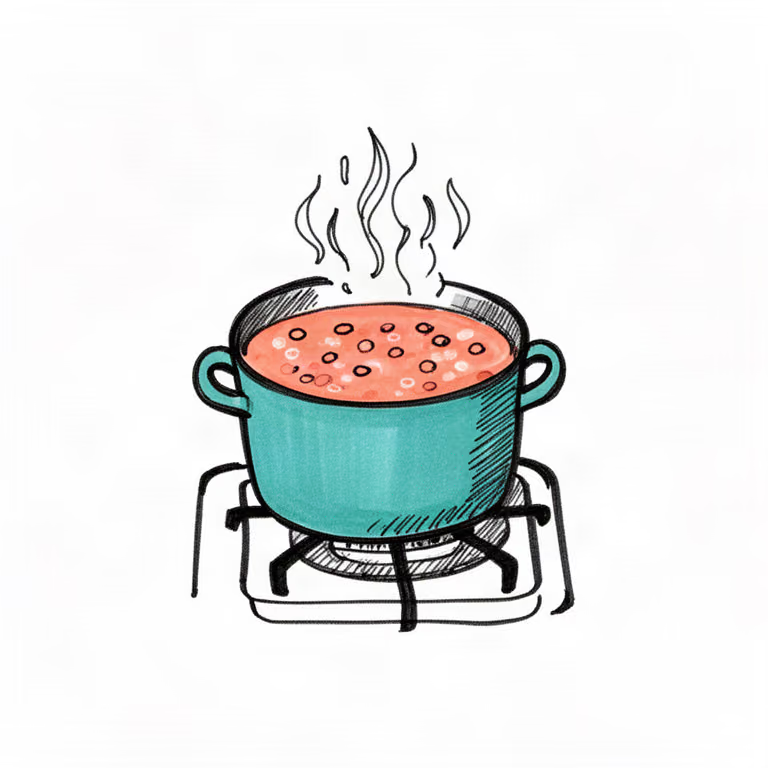
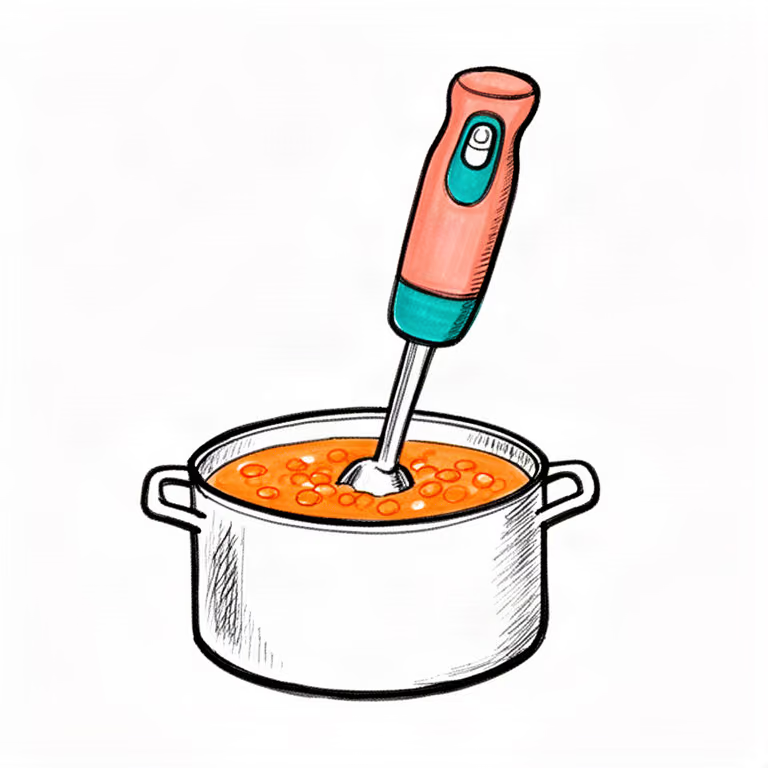
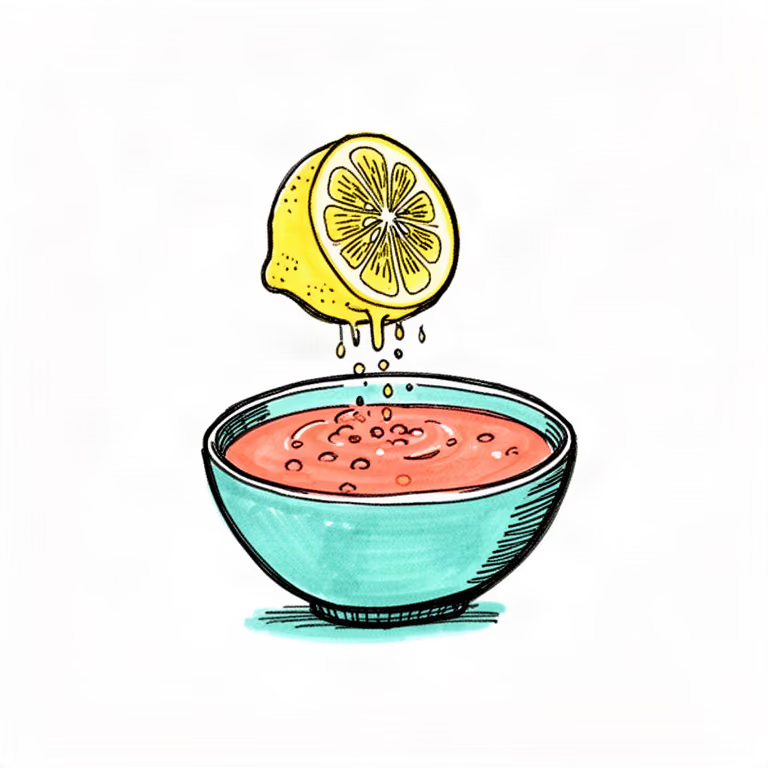
A recipe as illustrated steps in a marker-doodle style, with amounts and steps in real type.
$9.99once, yours to keep
Payments are non-refundable. See our Terms of service.
Yours. Download it, then add it to your agent.
Makes recipe infographics as one finished PNG for a post, lesson, slide or poster: bold marker doodles with coral and teal fills and hand-lettered labels on white. The drawings come from a picture model and every word is set in real type on top, so labels are always spelled right. Best as a flow of 4 to 8 steps; other layouts work too. Needs a FAL_KEY or a Cloudflare Workers AI key; about $0.01 to $0.02 a drawing. Use when someone wants a recipe infographic, an illustrated recipe, a recipe card with pictures or cooking steps as a picture.
By RecaplyUpdated 11 Nov
Video1 view, 0 downloads
One picture that explains how it works
 Video
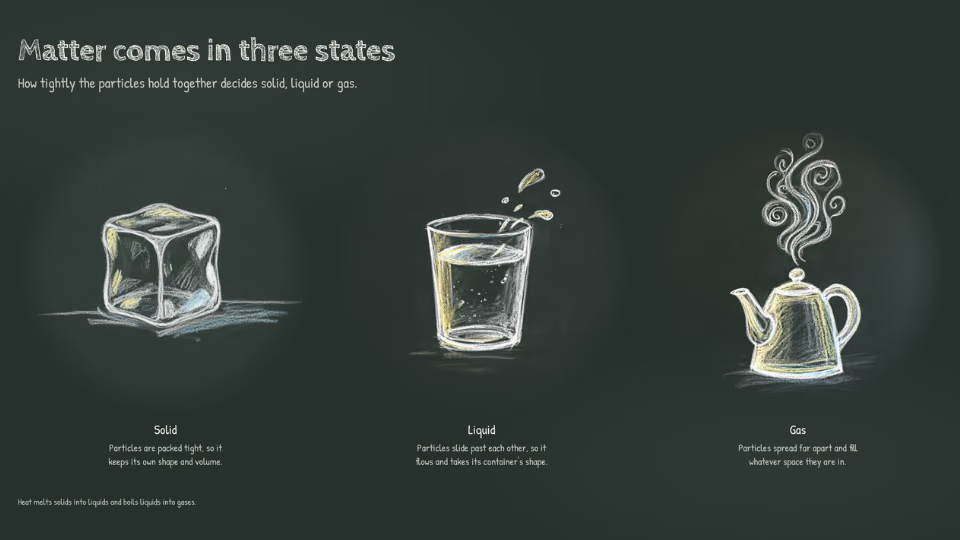
Lesson posters drawn in chalk
 Video
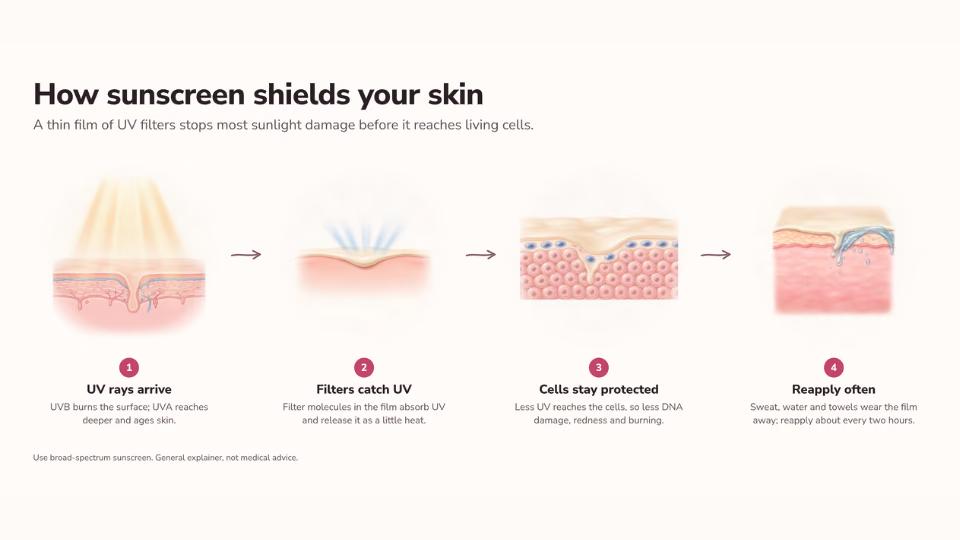
Medical art of how the body works
 Video
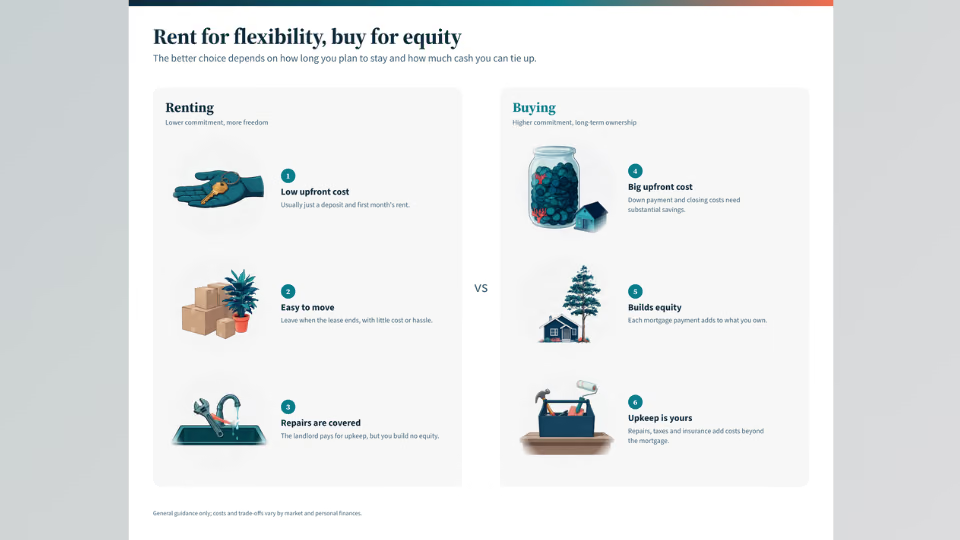
Side-by-side versus graphics
You say
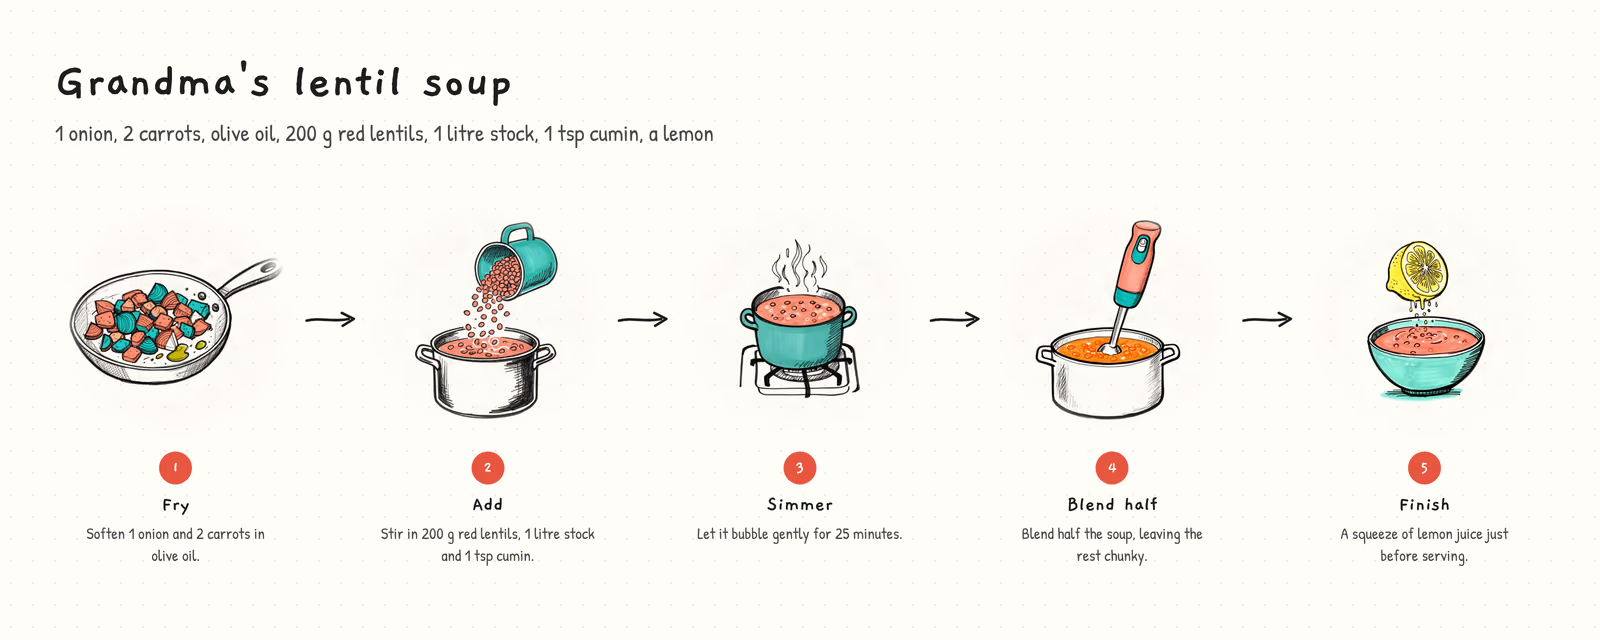
Turn my grandmother's soup recipe into an infographic
It said back
I've made your grandmother's lentil soup into an infographic: lentil-soup/explainer.png (3200×1280).
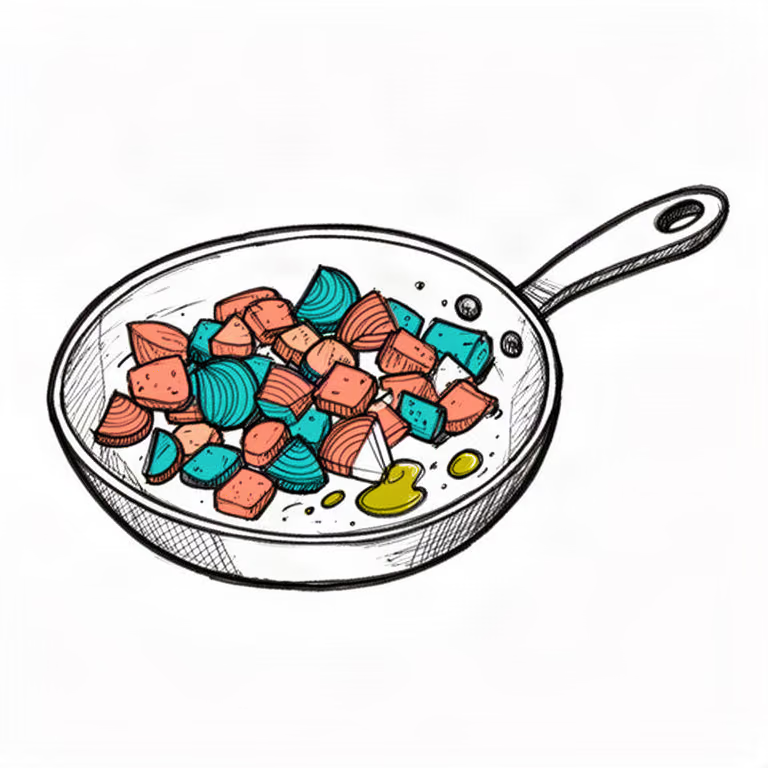
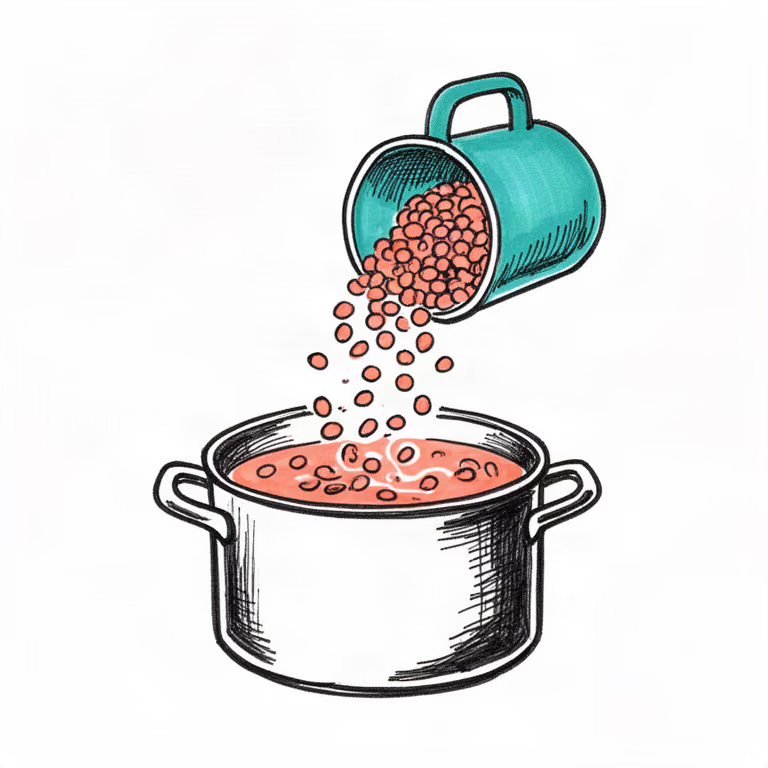
It shows the recipe as five steps from left to right: Fry → Add → Simmer → Blend half → Finish. Each step has a hand-drawn picture with its amounts underneath, and the full ingredient list sits under the title. I read every word on the finished image: everything is spelled correctly, nothing overlaps, and each picture matches its step.
What it did in run 1
No. Recipe Infographics costs $9.99 once and stays in your Recaply account, or it comes with the Recaply plan ($19.99 a month), which opens every premium skill and prompt.
Claude Code, Codex, Cursor, Gemini CLI, GitHub Copilot and OpenCode.
A ZIP of the whole skill folder (25 KB): the SKILL.md your agent follows and its 5 other files, the references, templates and scripts it uses. You download it from this page whenever you need it, and install it in Claude Code, Codex, Cursor, Gemini CLI, GitHub Copilot and OpenCode. The Recaply plan opens it too, with every other premium skill and prompt.
Buy it, then download the ZIP from this page. For Claude Code, unzip it into .claude/skills/ in your project. For Codex, Cursor and Gemini CLI, unzip it and run npx skills add ./recipe-infographic with your agent's flag.
One explainer picture, with every label set in real type. Drawn as bold marker doodles with coral and teal fills and hand-lettered labels on white. Labels spelled exactly; the model never draws words.
Node 20+, Chrome and a fal or Cloudflare Workers AI key (it reads FAL_KEY). Each use costs about $0.01 to $0.02 a drawing.
6 files, about 15,071 tokens in all. The SKILL.md is about 2,099 tokens, and your agent reads it only when the job fits.
Our 1 runs took 1 min 23 s to 1 min 23 s and $0.32 to $0.32 of API use each, in Claude Code with claude-opus-5-5. On a Claude plan, a run counts toward your usage instead.
Type /recipe-infographic first to make sure it loads. Without it, Claude Code may judge a small job simple enough to do without the skill.