Skip to content

DirectorySkills

Data ledger slide deck: 01, made in this run
Run 1Data ledger slide deck“Make a budget deck from this spreadsheet”
Runs in
  • Claude Code
  • Codex
  • Cursor
  • Gemini CLI
  • GitHub Copilot
  • OpenCode
Generates with
Your agent's model
Tested with
Claude Code 2.1.322Claude Opus 5.51 real run, 9 Nov
Needs
Node 20+Chromeffmpeg
Licence
Recaply licence

Data Ledger Slide Deck

Slide decks that look like a clean analytics ledger in electric blue and lime, as PDF, PNGs, browser deck and PowerPoint.

$9.99once, yours to keep

Makes slide decks styled as a clean analytics ledger in electric blue and lime, from notes, a document or figures: title, agenda, section, bullet, column, card, picture, quote, big number, chart, timeline, table, formula and closing slides, saved as a PDF, a PNG per slide, a deck that plays in the browser and an editable PowerPoint file, with speaker notes. Clean white pages, electric blue headlines and data, lime label chips, thin rounded bars and hairline rules. Every word is set in real type and checked to fit; no picture model, no key and no cost. Use when a finance or data team wants a crisp, analytical deck with charts and tables, or when someone asks for a presentation, slides or a deck with a analytics look.

By RecaplyUpdated 11 Nov

Install Data Ledger Slide Deck

After the download, ask your agent to add it, or run the line yourself.

Read https://recaply.co/skills/data-ledger-deck/install.md and follow it to install the data-ledger-deck skill from data-ledger-deck.zip.

Paste it into your agent. It reads our install steps, finds the ZIP you downloaded and adds the skill for you.

New to skills? How to install a skill

Similar skills

All 735 skills

Who Data Ledger Slide Deck is for

What you get

  • A PDF, a PowerPoint file and a web page to present from
  • The analytics look: a clean analytics ledger in electric blue and lime
  • Every slide checked to fit before it is saved

Good fit

  • Finance reviews
  • Analytics
  • Data reports

Not for

  • Filling in an existing PowerPoint template
  • Decks in another company's brand

About this skill

You say

Make a budget deck from this spreadsheet

It said back

I made a 6-slide budget deck from budget.csv. All slides passed the fit check and I looked at each one.

Files (in budget-deck/budget-2027/):

  • budget-2027.pdf: one page per slide
  • budget-2027.pptx: editable PowerPoint, with speaker notes
  • budget-2027.html: plays in a browser (N shows notes, E lets you edit the text)
  • slides/01.png to 06.png, plus notes.md
Show more

What it did in run 1

  1. ls -la
  2. ./budget.csv
  3. data-ledger-deck
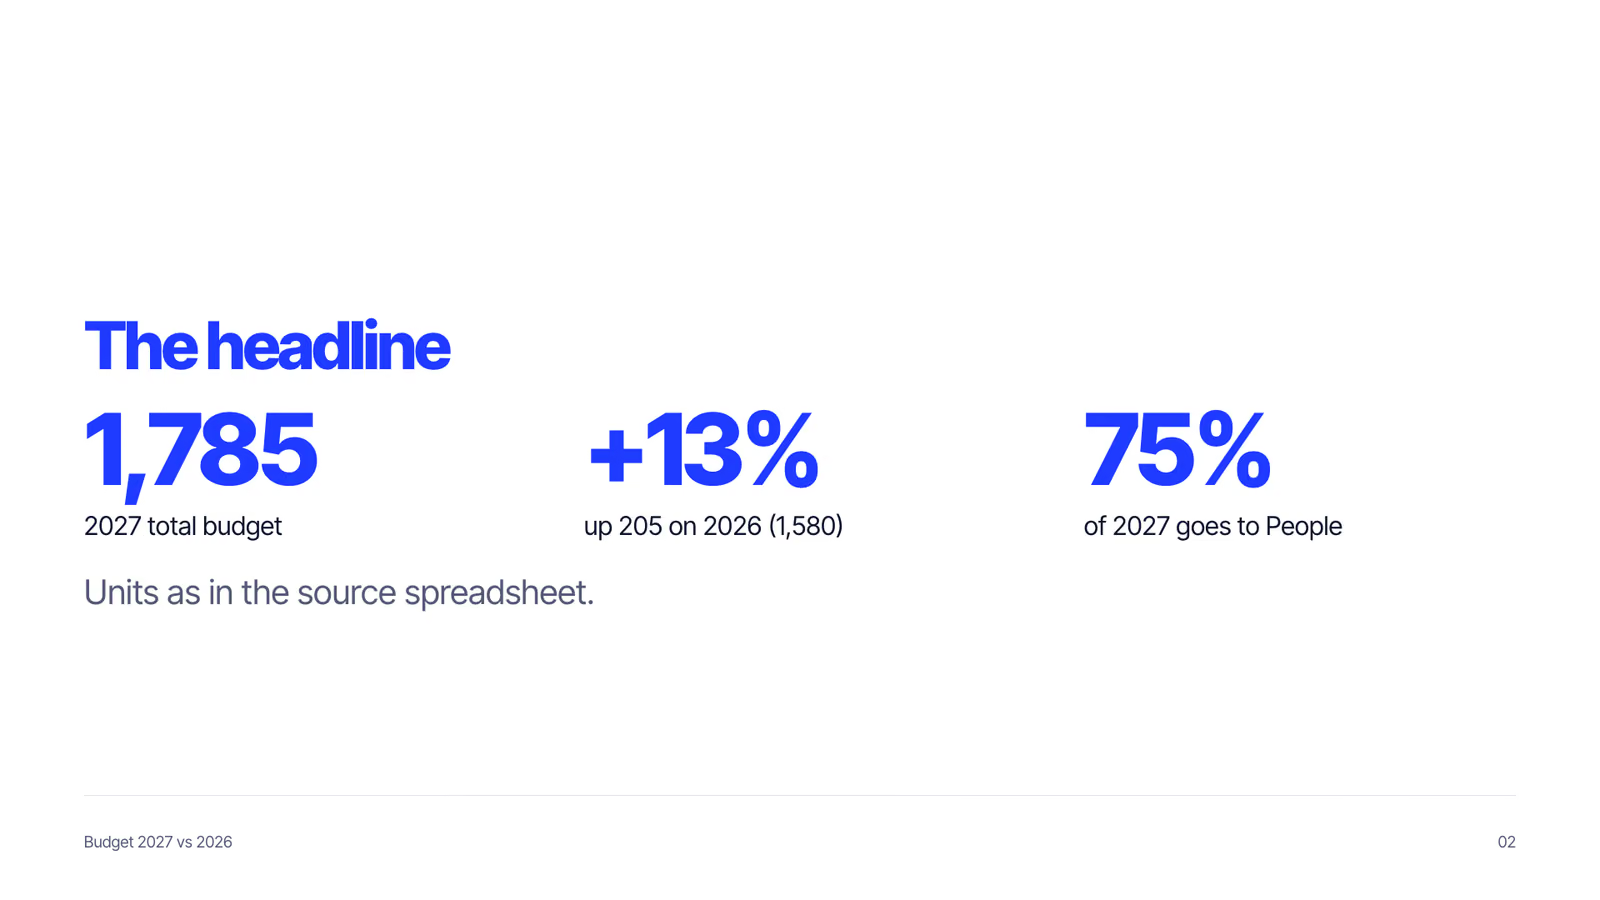
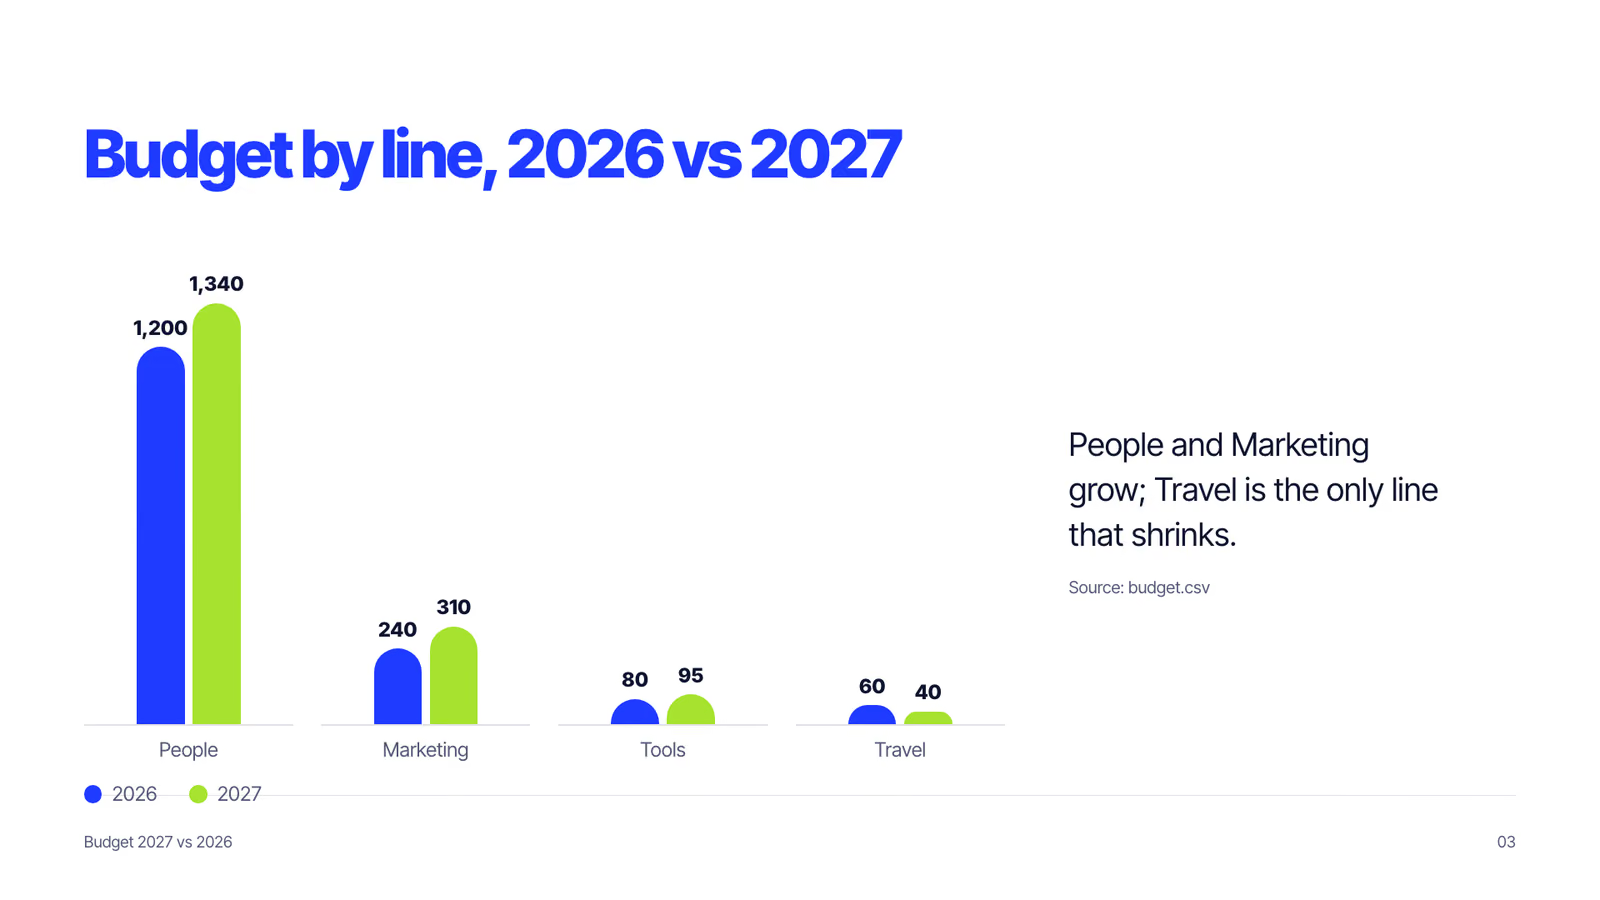
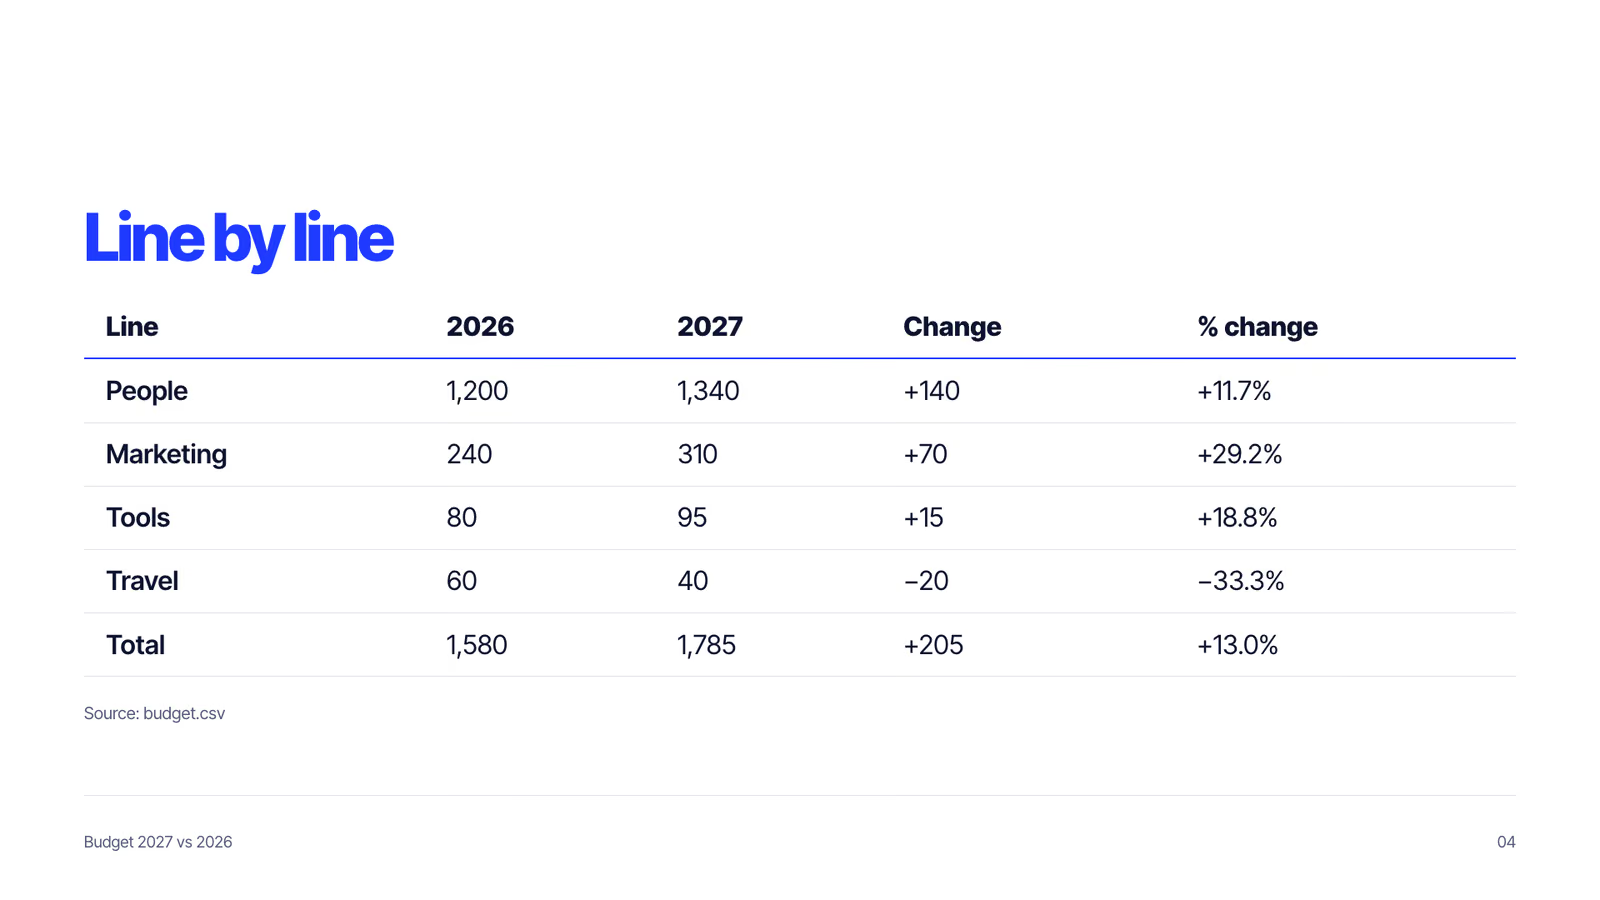
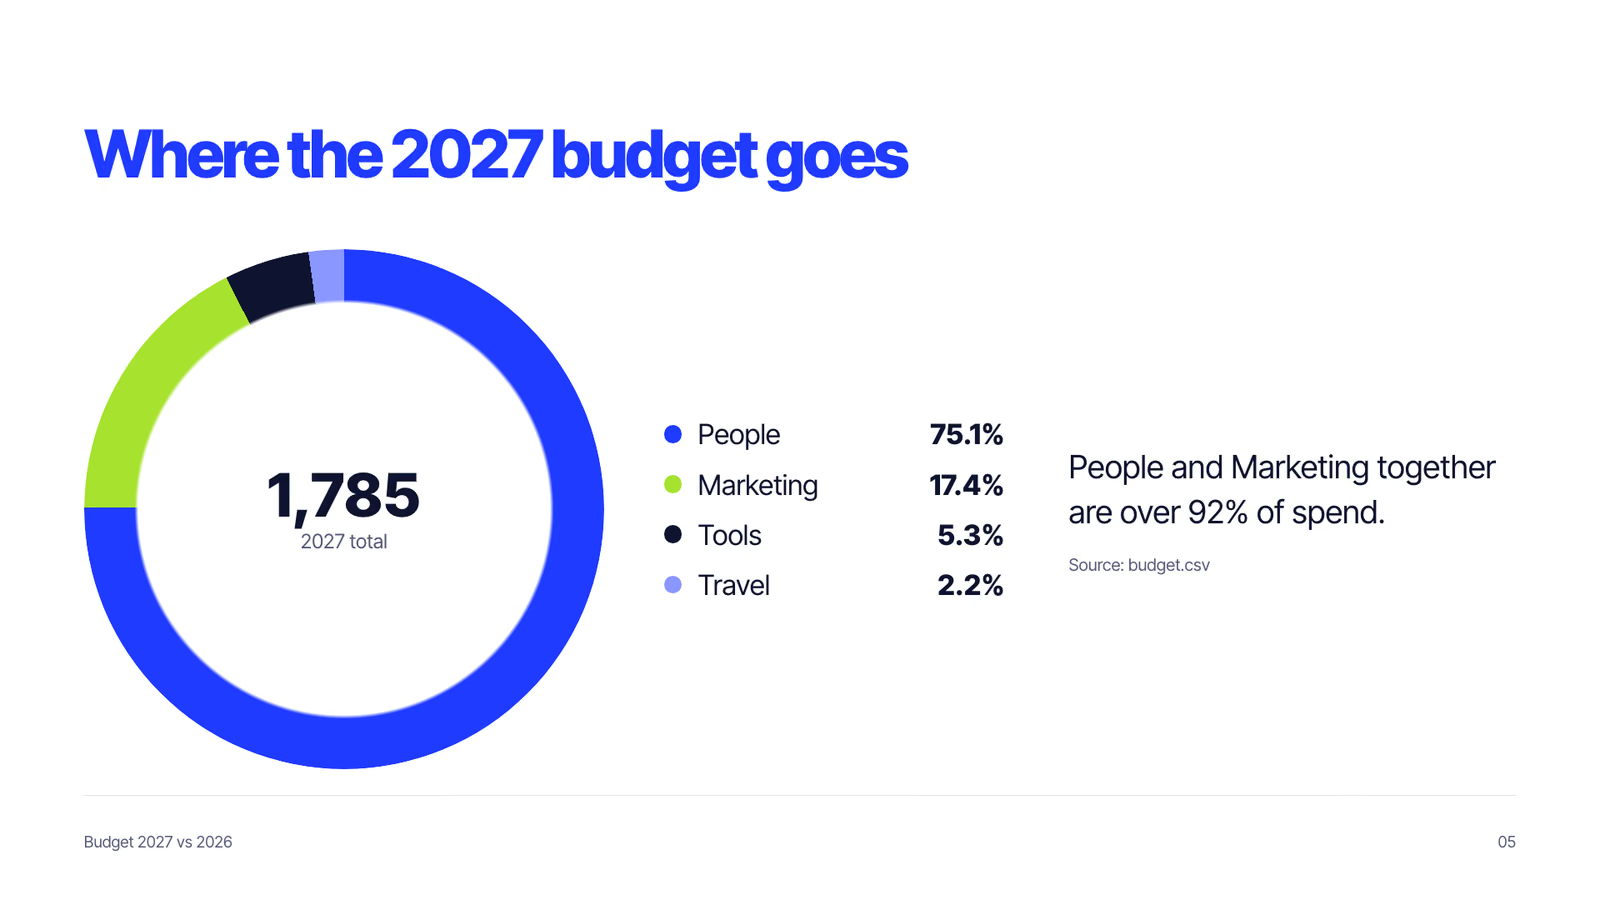
  4. mkdir -p budget-deck && cat > budget-deck/deck.json <<'EOF' { "title": "Budget 2027", "footer": "Budget 2027 vs 2026", "slides": [ { "layout": "title", "kicker": "Budget review", "title": "Budget 2027", "subtitle": "Four lines, 2026 against 2027: what grows, what shrinks.", "notes": "This deck compares the 2026 and 2027 budgets across four lines: People, Marketing, Tools and Travel. Figures come straight from budget.csv; units are as given there." }, { "layout": "stat", "title": "The headline", "stats": [ { "value": "1,785", "label": "2027 total budget" }, { "value": "+13%", "label": "up 205 on 2026 (1,580)" }, { "value": "75%", "label": "of 2027 goes to People" } ], "subtitle": "Units as in the source spreadsheet.", "notes": "The total rises from 1,580 to 1,785, an increase of 205 or about 13 percent. Three quarters of the 2027 budget is People." }, { "layout": "chart", "title": "Budget by line, 2026 vs 2027", "chart": { "type": "bar", "labels": ["People", "Marketing", "Tools", "Travel"], "series": [ { "name": "2026", "values": [1200, 240, 80, 60] }, { "name": "2027", "values": [1340, 310, 95, 40] } ] }, "subtitle": "People and Marketing grow; Travel is the only line that shrinks.", "source": "budget.csv", "notes": "People goes from 1,200 to 1,340. Marketing from 240 to 310. Tools from 80 to 95. Travel falls from 60 to 40." }, { "layout": "table", "title": "Line by line", "table": { "columns": ["Line", "2026", "2027", "Change", "% change"], "rows": [ ["People", "1,200", "1,340", "+140", "+11.7%"], ["Marketing", "240", "310", "+70", "+29.2%"], ["Tools", "80", "95", "+15", "+18.8%"], ["Travel", "60", "40", "−20", "−33.3%"], ["Total", "1,580", "1,785", "+205", "+13.0%"] ], "highlight": 5 }, "source": "budget.csv", "notes": "Marketing is the fastest-growing line at plus 29 percent. People is the biggest increase in absolute terms, plus 140, about two thirds of the total increase. Travel is cut by a third." }, { "layout": "chart", "title": "Where the 2027 budget goes", "chart": { "type": "donut", "labels": ["People", "Marketing", "Tools", "Travel"], "series": [ { "name": "Share", "values": [75.1, 17.4, 5.3, 2.2] } ], "unit": "%", "center": "1,785", "centerLabel": "2027 total" }, "subtitle": "People and Marketing together are over 92% of spend.", "source": "budget.csv", "notes": "People is 75 percent of the 2027 budget, Marketing 17, Tools 5 and Travel 2." }, { "layout": "closing", "title": "In short", "subtitle": "2027 rises 13% to 1,785: People and Marketing grow, Travel falls by a third.", "notes": "To sum up: the budget grows 13 percent, driven mainly by People in absolute terms and Marketing in relative terms, partly offset by a cut to Travel." } ] } EOF node .claude/skills/data-ledger-deck/scripts/deck.mjs budget-deck/deck.json --check
  5. ./budget-deck/deck.json
  6. node .claude/skills/data-ledger-deck/scripts/deck.mjs budget-deck/deck.json --check
  7. ./budget-deck/budget-2027/check.png
  8. node .claude/skills/data-ledger-deck/scripts/deck.mjs budget-deck/deck.json && ls budget-deck/budget-2027
  9. Done

9 Nov 2026 · Claude Code 2.1.322 with Claude Opus 5.5 · 1 min 13 s · $0.28 of API use

Questions

Is Data Ledger Slide Deck free?

No. Data Ledger Slide Deck costs $9.99 once and stays in your Recaply account, or it comes with the Recaply plan ($19.99 a month), which opens every premium skill and prompt.

Which agents can use Data Ledger Slide Deck?

Claude Code, Codex, Cursor, Gemini CLI, GitHub Copilot and OpenCode.

What do I get when I buy Data Ledger Slide Deck?

A ZIP of the whole skill folder (40 KB): the SKILL.md your agent follows and its 6 other files, the references, templates and scripts it uses. You download it from this page whenever you need it, and install it in Claude Code, Codex, Cursor, Gemini CLI, GitHub Copilot and OpenCode. The Recaply plan opens it too, with every other premium skill and prompt.

How do I install Data Ledger Slide Deck?

Buy it, then download the ZIP from this page. For Claude Code, unzip it into .claude/skills/ in your project. For Codex, Cursor and Gemini CLI, unzip it and run npx skills add ./data-ledger-deck with your agent's flag.

What do I get from Data Ledger Slide Deck?

A PDF, a PowerPoint file and a web page to present from. The analytics look: a clean analytics ledger in electric blue and lime. Every slide checked to fit before it is saved.

What does Data Ledger Slide Deck need?

Node 20+, Chrome and ffmpeg, and no API key. Each use costs nothing beyond your agent.

How big is Data Ledger Slide Deck?

7 files, about 26,882 tokens in all. The SKILL.md is about 3,239 tokens, and your agent reads it only when the job fits.

What does a run cost?

Our 1 runs took 1 min 13 s to 1 min 13 s and $0.28 to $0.28 of API use each, in Claude Code with claude-opus-5-5. On a Claude plan, a run counts toward your usage instead.

Do I have to name Data Ledger Slide Deck to use it?

Type /data-ledger-deck first to make sure it loads. Without it, Claude Code may judge a small job simple enough to do without the skill.